
UNITED STATES
SECURITIES AND EXCHANGE COMMISSION
Washington, D.C. 20549
FORM 8-K
CURRENT REPORT
Pursuant to Section 13 or 15(d) of the
Securities Exchange Act of 1934
Date of Report (Date of earliest event reported)
(Exact name of Registrant as specified in its charter)
| (State or other jurisdiction of incorporation) | (Commission File No.) | (I.R.S. Employer Identification No.) | ||||||||||||
| (Address of principal executive offices including zip code) | ||
(318 ) 255-2222
| (Registrant's telephone number, including area code) | ||
| (Former name or former address, if changed since last report) | ||
Check the appropriate box below if the Form 8-K filing is intended to simultaneously satisfy the filing obligation of the registrant under any of the following provisions:
Securities registered pursuant to Section 12(b) of the Act:
| Title of each class | Trading Symbol(s) | Name of each exchange on which registered | ||||||||||||
| Texas Stock Exchange | ||||||||||||||
| Indicate by check mark whether the registrant is an emerging growth company as defined in Rule 405 of the Securities Act of 1933 (§230.405 of this chapter) or Rule 12b-2 of the Securities Exchange Act of 1934 (§240.12b-2 of this chapter). | |||||
Emerging growth company ☐
If an emerging growth company, indicate by check mark if the registrant has elected not to use the extended transition period for complying with any new or revised financial accounting standards provided pursuant to Section 13(a) of the Exchange Act. ¨ | |||||
| ITEM 2.02 | Results of Operations and Financial Condition | ||||
On October 28, 2026, Origin Bancorp, Inc. (the "Company" or the "Registrant") issued a press release announcing its third quarter 2026 results of operations. A copy of the press release is attached hereto as Exhibit 99.1, which is incorporated herein by reference.
On Thursday, October 29, 2026, at 8:00 a.m. Central Time, the Company will host an investor conference call and webcast to review its third quarter 2026 financial results. The webcast will include presentation materials, which consist of information regarding the Company's results of operations and financial performance. The presentation materials will be posted on the Company's website on October 28, 2026. The presentation materials are attached hereto as Exhibit 99.2, which is incorporated herein by reference.
As provided in General Instructions B.2 to Form 8-K, the information furnished in Item 2.02, Exhibit 99.1 and Exhibit 99.2 of this Current Report on Form 8-K shall not be deemed "filed" for purposes of Section 18 of the Securities Exchange Act of 1934, as amended (the "Exchange Act"), or otherwise subject to the liabilities of that section, and such information shall not be deemed incorporated by reference in any filing under the Securities Act of 1933, as amended, or the Exchange Act, except as shall be expressly set forth by specific reference in such filing.
| ITEM 8.01 | Other Events | ||||
On October 28, 2026, the Company issued a press release announcing that the board of directors of the Company declared a quarterly cash dividend of $0.28 per share of its common stock. The cash dividend will be paid on November 30, 2026, to stockholders of record as of the close of business on November 13, 2026. The press release is attached hereto as Exhibit 99.3, and incorporated herein by reference.
| ITEM 9.01 | Financial Statements and Exhibits | ||||
| (d) | Exhibits. | ||||
| Exhibit 99.1 | |||||
| Exhibit 99.2 | |||||
| Exhibit 99.3 | |||||
| Exhibit 104 | Cover Page Interactive Data File (embedded within the Inline XBRL document) | ||||
SIGNATURES
Pursuant to the requirements of the Securities Exchange Act of 1934, as amended, the Registrant has duly caused this report to be signed on its behalf by the undersigned thereunto duly authorized.
Dated: October 28, 2026 | ORIGIN BANCORP, INC. | |||||||
By: /s/ William J. Wallace, IV | ||||||||
| William J. Wallace, IV | ||||||||
| Senior Executive Officer and Chief Financial Officer | ||||||||
Exhibit 99.1
For Immediate Release

ORIGIN BANCORP, INC. REPORTS EARNINGS FOR THIRD QUARTER 2026
RUSTON, Louisiana (October 28, 2026) - Origin Bancorp, Inc. (TXSE: OBK) (“Origin,” “we,” “our” or the “Company”), the holding company for Origin Bank (the “Bank”), today announced net income of $37.8 million, or $1.22 diluted earnings per share (“EPS”), for the quarter ended September 30, 2026, compared to net income of $33.8 million, or $1.09 diluted EPS, for the quarter ended June 30, 2026. Pre-tax, pre-provision (“PTPP”)(1) earnings were $50.7 million for the quarter ended September 30, 2026, compared to $43.2 million for the linked quarter.
“Our third quarter results reflect the discipline and commitment of our team and the progress we are making through Optimize Origin,” said Drake Mills, chairman, president and CEO of Origin Bancorp, Inc. “We are delivering higher levels of profitability while deepening relationships and investing intentionally in our franchise. I am proud of what we accomplished this quarter, and we know there is more work ahead as we continue delivering long-term value to our shareholders.”
(1) PTPP earnings is a non-GAAP financial measure, please see the last few pages of this document for a reconciliation of this alternative financial measure to its most directly comparable GAAP measure.
Optimize Origin
•In January 2025, we announced our Optimize Origin initiative to drive elite financial performance and enhance our award-winning culture, and it continues to be an important part of our corporate DNA.
•Built on three primary pillars:
◦Productivity, Delivery & Efficiency
◦Balance Sheet Optimization
◦Culture & Employee Engagement
•As announced in our Fourth Quarter and Full Year 2025 Earnings Release, our near term ROAA run rate target is 1.15% or higher by 4Q26, as we continue towards our ultimate top quartile ROAA target.
Financial Highlights
•The Company continued to deliver strong performance, and in some cases, record performance across numerous key financial metrics including, but not limited to, net income, net interest income, fully tax-equivalent net interest margin (“NIM-FTE”) and diluted earnings per share.
•Net income was $37.8 million for the quarter ended September 30, 2026, reflecting an increase of $3.9 million, or 11.6%, compared to the linked quarter.
•Non-interest income was $18.1 million for the quarter ended September 30, 2026, reflecting an increase of $2.7 million, or 17.5%, compared to the linked quarter.
•Our NIM-FTE increased two basis points to 3.94% for the quarter ended September 30, 2026, compared to the quarter ended June 30, 2026.
•Annualized ROAA was 1.47% for the quarter ended September 30, 2026, reflecting an increase of 12 basis points, compared to the quarter ended June 30, 2026.
1
•Total loans held for investment (“LHFI”) were $8.09 billion at September 30, 2026, reflecting an increase of $20.6 million, or 0.3%, compared to June 30, 2026. LHFI, excluding mortgage warehouse lines of credit, were $7.65 billion at September 30, 2026, reflecting an increase of $170.6 million, or 2.3%, compared to June 30, 2026.
•During the quarter ended September 30, 2026, we repurchased 272,927 shares of our common stock at an average price of $54.21 per share, including commissions and applicable excise taxes. At September 30, 2026, $106.8 million remains available for share repurchases under the share repurchase program.
•In October 2026, our board approved an increase in our quarterly dividend from $0.25 to $0.28 per share, a 12% increase. Combined with the $0.10 per share increase approved in April 2026, the quarterly dividend has increased from $0.15 to $0.28 per share, or 87%, reflecting our strong balance sheet and durable earnings.
Results of Operations for the Quarter Ended September 30, 2026
Net Interest Income and Net Interest Margin
Net interest income for the quarter ended September 30, 2026, was $95.1 million, an increase of $2.9 million, or 3.2%, compared to the quarter ended June 30, 2026. The expansion in net interest income was primarily driven by a $4.3 million increase in interest income, which was partially offset by a $1.4 million increase in interest expense.
The $4.3 million increase in interest income was primarily due to an increase of $3.6 million in interest income on loans held for investment, mainly driven by higher average loan balances, which contributed $1.6 million of the increase. An additional $1.4 million of the increase resulted from one additional calendar day during the current quarter, while the remaining $648,000 was attributable to higher loan yields.
The $1.4 million increase in interest expense was primarily attributable to a $2.1 million increase in interest expense on interest-bearing deposits, partially offset by a $740,000 decrease in interest expense on FHLB advances and other borrowings. The increase in interest expense on interest-bearing deposits was primarily attributable to higher average balances, which increased interest expense by $1.1 million. This impact was primarily related to higher average money market deposit balances, which increased interest expense by $1.6 million, partially offset by lower average balances in interest-bearing demand deposits. Higher rates and one extra day in the quarter contributed another $1.0 million to the increase in interest expense on deposits. The decrease in interest expense on FHLB and other borrowings was mainly attributable to lower average borrowing balances, which decreased interest expense by approximately $762,000.
The Federal Reserve Board sets various benchmark rates, including the federal funds rate, and thereby influences the general market rates of interest, including loan and deposit rates offered by financial institutions. On October 29, 2025, and December 10, 2025, the Federal Reserve Board reduced the federal funds target rate range by 25 basis points each, to a range of 3.50% to 3.75%. On September 16, 2026, the Federal Reserve Board raised the federal funds target rate range by 25 basis points, to a range of 3.75% to 4.00%.
Our NIM-FTE was 3.94% for the quarter ended September 30, 2026, up two basis points from the linked quarter and 29 basis points from the quarter ended September 30, 2025. The yield earned on interest-earning assets was 5.76%, representing a two-basis-point increase and a 13-basis-point decrease compared to the linked quarter and the quarter ended September 30, 2025, respectively. The average rate paid on total interest-bearing liabilities was 2.70%, representing a three-basis-point increase from the linked quarter and down 52 basis points compared to the quarter ended September 30, 2025.
2
Credit Quality
The table below includes key credit quality information:
| At and For the Three Months Ended | Change | % Change | |||||||||||||||||||||||||||
| (Dollars in thousands, unaudited) | September 30, 2026 | June 30, 2026 | September 30, 2025 | Linked Quarter | Linked Quarter | ||||||||||||||||||||||||
| Past due 30 to 89 days and still accruing | $ | 10,308 | $ | 5,203 | $ | 7,739 | $ | 5,105 | 98.1 | % | |||||||||||||||||||
| Total nonperforming LHFI | 72,461 | 78,522 | 88,282 | (6,061) | (7.7) | ||||||||||||||||||||||||
| Nonperforming Assets | 75,102 | 79,281 | 88,859 | (4,179) | (5.3) | ||||||||||||||||||||||||
Allowance for loan credit losses (“ALCL”) | 98,378 | 98,188 | 96,259 | 190 | 0.2 | ||||||||||||||||||||||||
| Provision for credit losses | 2,606 | 65 | 36,820 | 2,541 | N/M | ||||||||||||||||||||||||
| Net charge-offs | 2,661 | 454 | 31,383 | 2,207 | N/M | ||||||||||||||||||||||||
Credit quality ratios(1): | |||||||||||||||||||||||||||||
| ALCL to nonperforming LHFI | 135.77 | % | 125.05 | % | 109.04 | % | 10.72 | % | N/A | ||||||||||||||||||||
| ALCL to total LHFI | 1.22 | 1.22 | 1.28 | — | N/A | ||||||||||||||||||||||||
ALCL to total LHFI, adjusted(2) | 1.27 | 1.30 | 1.35 | (0.03) | N/A | ||||||||||||||||||||||||
| Nonperforming LHFI to LHFI | 0.90 | 0.97 | 1.17 | (0.07) | N/A | ||||||||||||||||||||||||
| Total nonperforming assets to LHFI & OREO | 0.93 | 0.98 | 1.18 | (0.05) | N/A | ||||||||||||||||||||||||
| Net charge-offs to total average LHFI (annualized) | 0.13 | 0.02 | 1.65 | 0.11 | N/A | ||||||||||||||||||||||||
N/A = Not applicable.
N/M - Not meaningful
(1)Please see the Loan Data schedule at the back of this document for additional information.
(2)The ALCL to total LHFI, adjusted, is calculated by excluding the ALCL for mortgage warehouse lines of credit loans from the total LHFI ALCL in the numerator and excluding the mortgage warehouse lines of credit loans from the LHFI in the denominator. Due to their low-risk profile, mortgage warehouse lines of credit loans require a disproportionately low allocation of the ALCL.
Our results included a total provision for credit losses of $2.6 million during the quarter ended September 30, 2026, compared to $65,000 for the linked quarter, which includes the provision for loan credit losses, the off-balance sheet commitment credit losses and any provision for security credit losses. The increase was primarily the result of new loan production and an increase in net loan charge-offs, offset by credit migration improvement during the quarter ended September 30, 2026, resulting in provision expense for loan credit losses of $2.9 million compared to a net benefit provision of $373,000 during the linked quarter. For the current quarter, we recorded reserves of $6.1 million related to new loan production and $1.3 million related to net charge-offs not previously reserved, which was primarily offset by $5.2 million in reserve releases related to net credit migration. Net credit migration reflects the combined impact of loan risk rating changes, specific reserve adjustments, and loan balance movements, such as loan balance changes and payoffs.
The ALCL totaled $98.4 million at September 30, 2026, a $190,000 increase compared to the ALCL as of June 30, 2026, and was 1.22% as a percentage of LHFI at both September 30, 2026 and June 30, 2026.
Past due 30 to 89 days and still accruing increased $5.1 million to $10.3 million at September 30, 2026, when compared to June 30, 2026, and represented 0.13% of total LHFI, compared to 0.06% as of June 30, 2026. The increase in loans past due 30 to 89 days and still accruing was primarily driven by increases of $2.5 million, $1.7 million and $1.1 million in the commercial and industrial, commercial real estate and construction/land/land development sectors, respectively. 100% of the increases were in the 30 to 59 days past due category.
Total nonperforming LHFI decreased $6.1 million at September 30, 2026, when compared to June 30, 2026. The decrease in nonperforming LHFI was driven by decreases in the sectors of commercial real estate, construction/land/land development and commercial and industrial, offset by an increase in single-family residential real estate nonperforming LHFI. $1.6 million of the decline in nonperforming LHFI was a result of net paydowns or payoffs of nonperforming loans, primarily in the construction/land/land development sector, impacted by the questioned banker activity first disclosed during the quarter ended June 30, 2024. During the current quarter, six loan relationships totaling $2.2 million previously classified as nonperforming LHFI were transferred to other real estate owned (“OREO”).
3
Net charge-offs were $2.7 million for the quarter ended September 30, 2026, reflecting an increase of $2.2 million compared to the quarter ended June 30, 2026, primarily reflecting lower recoveries of $1.5 million and an increase of $728,000 in charge-offs. The decrease in recoveries was primarily the result of lower recoveries in the commercial and industrial loan sector and the increase in charge-offs was primarily a result of higher charge-offs in the commercial real estate and commercial and industrial loan sectors.
Noninterest Income
Noninterest income for the quarter ended September 30, 2026, was $18.1 million, an increase of $2.7 million, or 17.5%, from the linked quarter, primarily driven by an increase of $1.7 million in equity method investment income and an increase of $452,000 in insurance commission and fee income.
The $1.7 million increase in equity method investment income was primarily driven by an increase in Argent investment income of $1.2 million compared to the linked quarter and a reduction of $499,000 in limited partnership equity investment loss during the current quarter compared to the linked quarter.
The components of equity method investment income (loss) are as follows:
| At and For the Three Months Ended | $ Change | % Change | |||||||||||||||||||||||||||
| (Dollars in thousands, unaudited) | September 30, 2026 | June 30, 2026 | September 30, 2025 | Linked Quarter | Linked Quarter | ||||||||||||||||||||||||
| Argent investment income | $ | 1,840 | $ | 668 | $ | 1,227 | $ | 1,172 | 175.4 | % | |||||||||||||||||||
| Limited partnership investment loss | (781) | (1,280) | (677) | 499 | 39.0 | ||||||||||||||||||||||||
| Total equity method investment income (loss) | $ | 1,059 | $ | (612) | $ | 550 | $ | 1,671 | 273.0 | % | |||||||||||||||||||
The $452,000 increase in insurance commission and fee income is primarily the result of an increase in life and health direct bill commission income.
Noninterest Expense
Noninterest expense for the quarter ended September 30, 2026, was $62.5 million, a decrease of $1.9 million, or 3.0% from the linked quarter. The decrease was primarily due to a decrease of $869,000 in other expenses along with a decrease of $543,000 in professional services.
The $869,000 decrease in other expense was primarily due to a $2.2 million release of contingency reserve offset by an $883,000 charge, both of which relate to the settlement of certain litigation involving the questioned banker activity first disclosed during the quarter ended June 30, 2024.
The $543,000 decrease in professional services was primarily due to a $452,000 decrease in consultant fees related to contract renegotiations that occurred during the first half of the 2026 fiscal year.
4
Financial Condition
The table below discloses the changes in certain balance sheet metrics:
| At and For the Three Months Ended | $ Change | % Change | |||||||||||||||||||||||||||
| (Dollars in thousands, unaudited) | September 30, 2026 | June 30, 2026 | September 30, 2025 | Linked Quarter | Linked Quarter | ||||||||||||||||||||||||
| Total LHFI | $ | 8,094,172 | $ | 8,073,577 | $ | 7,537,099 | $ | 20,595 | 0.3 | % | |||||||||||||||||||
| Average total LHFI | 8,059,674 | 7,954,669 | 7,523,624 | 105,005 | 1.3 | ||||||||||||||||||||||||
| Total securities | 1,145,994 | 1,158,652 | 1,121,551 | (12,658) | (1.1) | ||||||||||||||||||||||||
| Average total securities | 1,165,465 | 1,178,329 | 1,127,809 | (12,864) | (1.1) | ||||||||||||||||||||||||
| Total deposits | 8,673,174 | 8,703,251 | 8,331,830 | (30,077) | (0.3) | ||||||||||||||||||||||||
| Average total deposits | 8,684,836 | 8,463,422 | 8,232,260 | 221,414 | 2.6 | ||||||||||||||||||||||||
Total borrowings | 15,377 | 136,878 | 12,790 | (121,501) | (88.8) | ||||||||||||||||||||||||
| Average borrowings | 57,246 | 140,897 | 30,702 | (83,651) | (59.4) | ||||||||||||||||||||||||
| Total subordinated indebtedness | 16,619 | 16,594 | 89,715 | 25 | 0.2 | ||||||||||||||||||||||||
| Average total subordinated indebtedness | 16,608 | 16,582 | 89,692 | 26 | 0.2 | ||||||||||||||||||||||||
| Total shareholders’ equity | 1,263,687 | 1,281,057 | 1,214,756 | (17,370) | (1.4) | ||||||||||||||||||||||||
| Average total shareholders’ equity | 1,287,795 | 1,275,384 | 1,227,431 | 12,411 | 1.0 | ||||||||||||||||||||||||
Loans
•Excluding mortgage warehouse lines of credit, LHFI increased $170.6 million, or 2.3%, from June 30, 2026. The increase was primarily driven by increases of $78.1 million, $66.8 million, and $24.0 million in construction/land/land development, owner-occupied commercial real estate loans and non-owner-occupied commercial real estate, respectively. These increases were partially offset by a decrease of $19.1 million in commercial and industrial loans.
•Mortgage warehouse lines of credit at September 30, 2026, were $439.7 million, a decrease of $150.0 million, or 25.4%, from $589.7 million at June 30, 2026, and a decrease of $33.3 million, or 7.0%, compared to September 30, 2025.
Securities
•Accumulated other comprehensive loss, net of taxes, primarily associated with unrealized losses within the available for sale portfolio, was $96.4 million at September 30, 2026, an increase of $35.6 million, or 58.5%, from the linked quarter and an increase of $35.2 million, or 57.6% from September 30, 2025.
•The weighted average effective duration for the total securities portfolio was 4.65 years as of September 30, 2026, compared to 4.08 years as of June 30, 2026.
Deposits
•The increase in average deposits for the current quarter compared to linked quarter was primarily due to increases of $217.0 million and $80.0 million in money market and noninterest-bearing deposits, respectively. Offsetting these increases was a decrease of $79.9 million in average interest-bearing demand deposits.
•At September 30, 2026, June 30, 2026, and September 30, 2025, average noninterest-bearing deposits as a percentage of average total deposits were 24.9%, 24.6% and 23.1%, respectively.
Borrowings
•The decrease in the current quarter borrowings compared to the linked quarter primarily reflects lower FHLB short-term borrowings as the linked quarter included $125.0 million of additional borrowings used primarily to meet seasonal liquidity needs.
Subordinate debentures
•Total subordinated debentures at September 30, 2026, compared to September 30, 2025, declined primarily due to the redemption of $74.0 million in subordinated debentures during the quarter ended December 31, 2025, in conjunction with our Optimize Origin initiative.
5
Capital
•The decrease in shareholder’s equity at September 30, 2026, compared to the linked quarter was mainly due to $35.6 million of other comprehensive loss, net of tax, as well as $14.8 million in common share repurchases and $7.9 million of dividends declared, partially offset by net income of $37.8 million during the quarter ended September 30, 2026.
•Uses of regulatory capital since the beginning of 2025 consist of the following:
◦Repurchased 1,106,466 shares of our common stock at an average price of $42.97 per share, for a total of $47.5 million, including commissions and applicable excise taxes. There is currently $106.8 million remaining available for share repurchases under the share repurchase program.
◦Redeemed $143.6 million of subordinated debentures, including the amortization of the original issue discount and fair value mark.
◦Declared $39.4 million in dividends to our shareholders, excluding dividends declared in October 2026.
Conference Call
Origin will hold a conference call to discuss its third quarter 2026 results on Thursday, October 29, 2026, at 8:00 a.m. Central Time (9:00 a.m. Eastern Time). To participate in the live conference call, please dial +1 (929) 272-1574 (U.S. Local / International 1); +1 (857) 999-3259 (U.S. Local / International 2); +1 (888) 700-7550 (U.S. Toll Free), enter Conference ID: 40835 and request to be joined into the Origin Bancorp, Inc. (OBK) call. A simultaneous audio-only webcast may be accessed via Origin’s website at www.origin.bank under the Investor Relations, News & Events, Events & Presentations link or directly by visiting https://dealroadshow.com/e/ORIGIN3Q26.
If you are unable to participate during the live webcast, the webcast will be archived on the Investor Relations section of Origin’s website at www.origin.bank, under Investor Relations, News & Events, Events & Presentations.
About Origin
Origin Bancorp, Inc. is a financial holding company headquartered in Ruston, Louisiana. Origin’s wholly owned bank subsidiary, Origin Bank, was founded in 1912 in Choudrant, Louisiana. Deeply rooted in Origin’s history is a culture committed to providing personalized relationship banking to businesses, municipalities, and personal clients to enrich the lives of the people in the communities it serves. Origin provides a broad range of financial services and currently operates more than 57 locations in Dallas/Fort Worth, East Texas, Houston, North Louisiana, Mississippi, Alabama and the Florida Panhandle. In addition, Origin provides a broad range of insurance agency products and services through its wholly owned insurance agency subsidiary, Forth Insurance, LLC. For more information, visit www.origin.bank and www.forthinsurance.com.
Non-GAAP Financial Measures
Origin reports its results in accordance with generally accepted accounting principles in the United States of America ("GAAP"). However, management believes that certain supplemental non-GAAP financial measures may provide meaningful information to investors that is useful in understanding Origin's results of operations and underlying trends in its business. These non-GAAP financial measures are supplemental and should be viewed in addition to, and not as an alternative for, Origin's reported results prepared in accordance with GAAP. The following are the non-GAAP measures used in this release: PTPP earnings, PTPP ROAA, tangible book value per common share, and ROATCE.
Please see the last few pages of this release for reconciliations of non-GAAP measures to the most directly comparable financial measures calculated in accordance with GAAP.
6
Forward-Looking Statements
This press release contains certain forward-looking statements within the meaning of the Private Securities Litigation Reform Act of 1995. Forward-looking statements include information regarding Origin Bancorp, Inc’s (“Origin”, “we”, “our” or the “Company”) future financial performance, business and growth strategies, projected plans and objectives, and any expected purchases of its outstanding common stock, and related transactions and other projections based on macroeconomic and industry trends, including changes to interest rates by the Federal Reserve and the resulting impact on Origin’s results of operations, estimated forbearance amounts and expectations regarding the Company’s liquidity, including in connection with advances obtained from the FHLB, which are all subject to change and may be inherently unreliable due to the multiple factors that impact broader economic and industry trends, and any such changes may be material. Such forward-looking statements are based on various facts and derived utilizing important assumptions and current expectations, estimates and projections about Origin and its subsidiaries, any of which may change over time and some of which may be beyond Origin’s control. Statements or statistics preceded by, followed by or that otherwise include the words “assumes,” “anticipates,” “believes,” “estimates,” “expects,” “foresees,” “intends,” “plans,” “projects,” and similar expressions or future or conditional verbs such as “could,” “may,” “might,” “should,” “will,” and “would” and variations of such terms are generally forward-looking in nature and not historical facts, although not all forward-looking statements include the foregoing words. Further, certain factors that could affect Origin’s future results and cause actual results to differ materially from those expressed in the forward-looking statements include, but are not limited to: (1) the impact of current and future economic conditions generally and in the financial services industry, nationally and within Origin’s primary market areas, including the impact of tariffs, as well as the financial stress on borrowers and changes to customer and client behavior as a result of the foregoing; (2) changes in benchmark interest rates and the resulting impacts on net interest income; (3) deterioration of Origin’s asset quality; (4) factors that can impact the performance of Origin’s loan portfolio, including real estate values and liquidity in Origin’s primary market areas; (5) the financial health of Origin’s commercial borrowers and the success of construction projects that Origin finances; (6) changes in the value of collateral securing Origin’s loans; (7) the impact of generative artificial intelligence; (8) Origin’s ability to anticipate interest rate changes and manage interest rate risk; (9) the impact of heightened regulatory requirements, reduced debit interchange and overdraft income and the possibility of facing related adverse business consequences if our total assets grow in excess of $10 billion as of December 31 of any calendar year; (10) the effectiveness of Origin’s risk management framework and quantitative models; (11) Origin’s inability to receive dividends from Origin Bank and to service debt, pay dividends to Origin’s common shareholders, repurchase Origin’s shares of common stock and satisfy obligations as they become due; (12) the impact of labor pressures; (13) changes in Origin’s operation or expansion strategy or Origin’s ability to prudently manage its growth and execute its strategy; (14) changes in management personnel; (15) Origin’s ability to maintain important customer relationships, reputation or otherwise avoid liquidity risks; (16) increasing costs as Origin grows deposits; (17) operational risks associated with Origin’s business; (18) significant turbulence or a disruption in the capital or financial markets and the effect of market disruption and interest rate volatility on our investment securities; (19) increased competition in the financial services industry, particularly from regional and national institutions, as well as from fintech companies; (20) compliance with governmental and regulatory requirements and changes in laws, rules, regulations, interpretations or policies relating to financial institutions; (21) periodic changes to the extensive body of accounting rules and best practices; (22) further government intervention in the U.S. financial system; (23) a deterioration of the credit rating for U.S. long-term sovereign debt; (24) Origin’s ability to comply with applicable capital and liquidity requirements, including its ability to generate liquidity internally or raise capital on favorable terms, including continued access to the debt and equity capital markets; (25) natural disasters and other adverse weather events, pandemics, acts of terrorism, war, and other matters beyond Origin’s control; (26) developments in our mortgage banking business, including loan modifications, general demand, and the effects of judicial or regulatory requirements or guidance; (27) fraud or misconduct by internal or external actors (including Origin employees); (28) cybersecurity threats or security breaches and the cost of defending against them; (29) Origin’s ability to maintain adequate internal controls over financial and non-financial reporting; and (30) potential claims, damages, penalties, fines, costs and reputational damage resulting from pending or future litigation, regulatory proceedings and enforcement actions. For a discussion of these and other risks that may cause actual results to differ from expectations, please refer to the sections titled “Cautionary Note Regarding Forward-Looking Statements” and “Risk Factors” in Origin’s most recent and future Annual Reports on Form 10-K filed with the Securities and Exchange Commission and any updates to those sections set forth in Origin’s subsequent Quarterly Reports on Form 10-Q and Current Reports on Form 8-K. If one or more events related to these or other risks or uncertainties materialize, or if Origin’s underlying assumptions prove to be incorrect, actual results may differ materially from what Origin anticipates. Accordingly, you should not place undue reliance on any forward-looking statements. Any forward-looking statement speaks only as of the date on which it is made, and Origin does not undertake any obligation to publicly update or review any forward-looking statement, whether as a result of new information, future developments or otherwise.
7
New risks and uncertainties arise from time to time, and it is not possible for Origin to predict those events or how they may affect Origin. In addition, Origin cannot assess the impact of each factor on Origin’s business or the extent to which any factor, or combination of factors, may cause actual results to differ materially from those contained in any forward-looking statements. All forward-looking statements, expressed or implied, included in this communication are expressly qualified in their entirety by this cautionary statement. This cautionary statement should also be considered in connection with any subsequent written or oral forward-looking statements that Origin or persons acting on Origin’s behalf may issue. Annualized, pro forma, adjusted, projected, and estimated numbers are used for illustrative purposes only, are not forecasts, and may not reflect actual results.
This press release contains projected financial information with respect to Origin, including with respect to certain goals and strategic initiatives of Origin and the anticipated benefits thereof. This projected financial information constitutes forward-looking information and is for illustrative purposes only and should not be relied upon as necessarily being indicative of future results. The assumptions and estimates underlying such projected financial information are inherently uncertain and are subject to significant business, economic (including interest rate), competitive, and other risks and uncertainties. Actual results may differ materially from the results contemplated by the projected financial information contained herein and the inclusion of such projected financial information in this release should not be regarded as a representation by any person that such actions will be taken or accomplished or that the results reflected in such projected financial information with respect thereto will be achieved.
Contact:
Investor Relations
Chris Reigelman
318-497-3177
chris@origin.bank
Media Contact
Ryan Kilpatrick
318-232-7472
rkilpatrick@origin.bank
8
Origin Bancorp, Inc.
Selected Quarterly Financial Data
(Unaudited)
| Three Months Ended | |||||||||||||||||||||||||||||
| September 30, 2026 | June 30, 2026 | March 31, 2026 | December 31, 2025 | September 30, 2025 | |||||||||||||||||||||||||
| Income statement and share amounts | (Dollars in thousands, except per share amounts) | ||||||||||||||||||||||||||||
Net interest income | $ | 95,140 | $ | 92,200 | $ | 87,244 | $ | 86,694 | $ | 83,704 | |||||||||||||||||||
| Provision for credit losses | 2,606 | 65 | 4,965 | 3,158 | 36,820 | ||||||||||||||||||||||||
| Noninterest income | 18,080 | 15,393 | 16,795 | 16,736 | 26,128 | ||||||||||||||||||||||||
| Noninterest expense | 62,489 | 64,412 | 63,797 | 62,823 | 62,028 | ||||||||||||||||||||||||
Income before income tax expense | 48,125 | 43,116 | 35,277 | 37,449 | 10,984 | ||||||||||||||||||||||||
| Income tax expense | 10,347 | 9,270 | 7,584 | 7,933 | 2,361 | ||||||||||||||||||||||||
Net income | $ | 37,778 | $ | 33,846 | $ | 27,693 | $ | 29,516 | $ | 8,623 | |||||||||||||||||||
PTPP earnings(1) | $ | 50,731 | $ | 43,181 | $ | 40,242 | $ | 40,607 | $ | 47,804 | |||||||||||||||||||
Basic earnings per common share | 1.23 | 1.10 | 0.89 | 0.95 | 0.28 | ||||||||||||||||||||||||
| Diluted earnings per common share | 1.22 | 1.09 | 0.89 | 0.95 | 0.27 | ||||||||||||||||||||||||
| Dividends declared per common share | 0.25 | 0.25 | 0.15 | 0.15 | 0.15 | ||||||||||||||||||||||||
Weighted average common shares outstanding - basic | 30,769,835 | 30,848,905 | 30,942,565 | 30,964,128 | 31,183,092 | ||||||||||||||||||||||||
Weighted average common shares outstanding - diluted | 31,081,681 | 31,157,927 | 31,203,348 | 31,168,548 | 31,363,571 | ||||||||||||||||||||||||
Balance sheet data | |||||||||||||||||||||||||||||
Total LHFI | $ | 8,094,172 | $ | 8,073,577 | $ | 7,864,221 | $ | 7,670,917 | $ | 7,537,099 | |||||||||||||||||||
| Total LHFI excluding mortgage warehouse lines of credit | 7,654,495 | 7,483,871 | 7,341,931 | 7,142,136 | 7,064,131 | ||||||||||||||||||||||||
Total assets | 10,105,114 | 10,276,930 | 10,188,144 | 9,724,722 | 9,791,306 | ||||||||||||||||||||||||
| Total deposits | 8,673,174 | 8,703,251 | 8,756,268 | 8,307,247 | 8,331,830 | ||||||||||||||||||||||||
| Total shareholders’ equity | 1,263,687 | 1,281,057 | 1,260,275 | 1,246,685 | 1,214,756 | ||||||||||||||||||||||||
| Performance metrics and capital ratios | |||||||||||||||||||||||||||||
| Yield on LHFI | 6.17 | % | 6.14 | % | 6.06 | % | 6.22 | % | 6.33 | % | |||||||||||||||||||
| Yield on interest-earning assets | 5.76 | 5.74 | 5.56 | 5.76 | 5.89 | ||||||||||||||||||||||||
| Cost of interest-bearing deposits | 2.68 | 2.64 | 2.66 | 2.90 | 3.20 | ||||||||||||||||||||||||
| Cost of total deposits | 2.01 | 1.99 | 2.05 | 2.20 | 2.46 | ||||||||||||||||||||||||
| NIM - fully tax equivalent ("FTE") | 3.94 | 3.92 | 3.71 | 3.73 | 3.65 | ||||||||||||||||||||||||
| Return on average assets (annualized) ("ROAA") | 1.47 | 1.35 | 1.11 | 1.19 | 0.35 | ||||||||||||||||||||||||
PTPP ROAA (annualized)(1) | 1.97 | 1.73 | 1.61 | 1.64 | 1.95 | ||||||||||||||||||||||||
| Return on average shareholders’ equity (annualized) ("ROAE") | 11.64 | 10.64 | 8.86 | 9.50 | 2.79 | ||||||||||||||||||||||||
Return on average tangible common equity (annualized) ("ROATCE")(1) | 13.27 | 12.17 | 10.15 | 10.95 | 3.22 | ||||||||||||||||||||||||
| Book value per common share | $ | 41.29 | $ | 41.52 | $ | 40.81 | $ | 40.28 | $ | 39.23 | |||||||||||||||||||
Tangible book value per common share (1) | 36.14 | 36.37 | 35.61 | 35.04 | 33.95 | ||||||||||||||||||||||||
Efficiency ratio(2) | 55.19 | % | 59.87 | % | 61.32 | % | 60.74 | % | 56.48 | % | |||||||||||||||||||
Common equity tier 1 to risk-weighted assets(3) | 13.74 | 13.41 | 13.60 | 13.54 | 13.59 | ||||||||||||||||||||||||
Tier 1 capital to risk-weighted assets(3) | 13.85 | 13.59 | 13.79 | 13.73 | 13.79 | ||||||||||||||||||||||||
Total capital to risk-weighted assets(3) | 15.07 | 14.74 | 14.99 | 14.91 | 15.90 | ||||||||||||||||||||||||
Tier 1 leverage ratio(3) | 11.98 | 12.05 | 11.74 | 11.86 | 11.69 | ||||||||||||||||||||||||
__________________________
(1)PTPP earnings, PTPP ROAA, ROATCE and tangible book value per common share are either non-GAAP financial measures or use a non-GAAP contributor in the formula. For a reconciliation of these alternative financial measures to their most directly comparable GAAP measures, please see the last few pages of this release.
(2)Calculated by dividing noninterest expense by the sum of net interest income plus noninterest income.
(3)Ratios are calculated at the Company level, which is subject to the capital adequacy requirements of the Federal Reserve Board. September 30, 2026 ratios are estimated.
9
Origin Bancorp, Inc.
Selected Year-To-Date Financial Data
(Unaudited)
| Nine Months Ended September 30, | |||||||||||
| (Dollars in thousands, except per share amounts) | 2026 | 2025 | |||||||||
| Income statement and share amounts | |||||||||||
Net interest income | $ | 274,584 | $ | 244,299 | |||||||
| Provision for credit losses | 7,636 | 43,126 | |||||||||
Noninterest income | 50,268 | 43,098 | |||||||||
| Noninterest expense | 190,698 | 186,079 | |||||||||
Income before income tax expense | 126,518 | 58,192 | |||||||||
Income tax expense | 27,201 | 12,511 | |||||||||
Net income | $ | 99,317 | $ | 45,681 | |||||||
PTPP earnings(1) | $ | 134,154 | $ | 101,318 | |||||||
| Basic earnings per common share | 3.22 | 1.46 | |||||||||
| Diluted earnings per common share | 3.19 | 1.46 | |||||||||
| Dividends declared per common share | 0.65 | 0.45 | |||||||||
Weighted average common shares outstanding - basic | 30,853,135 | 31,193,739 | |||||||||
Weighted average common shares outstanding - diluted | 31,172,097 | 31,382,010 | |||||||||
| Performance metrics | |||||||||||
| Yield on LHFI | 6.13 | % | 6.33 | % | |||||||
| Yield on interest-earning assets | 5.69 | 5.85 | |||||||||
| Cost of interest-bearing deposits | 2.66 | 3.21 | |||||||||
| Cost of total deposits | 2.02 | 2.48 | |||||||||
| NIM-FTE | 3.86 | 3.57 | |||||||||
ROAA (annualized) | 1.31 | 0.63 | |||||||||
PTPP ROAA (annualized)(1) | 1.77 | 1.39 | |||||||||
ROAE (annualized) | 10.40 | 5.11 | |||||||||
ROATCE (annualized)(1) | 11.89 | 5.93 | |||||||||
Efficiency ratio(2) | 58.70 | 64.75 | |||||||||
____________________________
(1)PTPP earnings, PTPP ROAA, and ROATCE are either non-GAAP financial measures or use a non-GAAP contributor in the formula. For a reconciliation of these alternative financial measures to their most directly comparable GAAP measures, please see the last few pages of this release.
(2)Calculated by dividing noninterest expense by the sum of net interest income plus noninterest income.
10
Origin Bancorp, Inc.
Consolidated Quarterly Statements of Income
(Unaudited)
| Three Months Ended | |||||||||||||||||||||||||||||
| September 30, 2026 | June 30, 2026 | March 31, 2026 | December 31, 2025 | September 30, 2025 | |||||||||||||||||||||||||
| Interest and dividend income | (Dollars in thousands, except per share amounts) | ||||||||||||||||||||||||||||
| Interest and fees on loans | $ | 125,458 | $ | 121,857 | $ | 114,161 | $ | 119,282 | $ | 120,096 | |||||||||||||||||||
| Investment securities-taxable | 8,844 | 9,039 | 8,776 | 8,991 | 8,767 | ||||||||||||||||||||||||
| Investment securities-nontaxable | 1,632 | 1,517 | 1,486 | 1,487 | 1,523 | ||||||||||||||||||||||||
| Interest and dividend income on assets held in other financial institutions | 4,101 | 3,310 | 6,873 | 4,884 | 5,753 | ||||||||||||||||||||||||
| Total interest and dividend income | 140,035 | 135,723 | 131,296 | 134,644 | 136,139 | ||||||||||||||||||||||||
| Interest expense | |||||||||||||||||||||||||||||
| Interest-bearing deposits | 44,108 | 42,001 | 43,702 | 46,510 | 51,026 | ||||||||||||||||||||||||
| FHLB advances and other borrowings | 543 | 1,283 | 111 | 102 | 273 | ||||||||||||||||||||||||
| Subordinated indebtedness | 244 | 239 | 239 | 1,338 | 1,136 | ||||||||||||||||||||||||
| Total interest expense | 44,895 | 43,523 | 44,052 | 47,950 | 52,435 | ||||||||||||||||||||||||
Net interest income | 95,140 | 92,200 | 87,244 | 86,694 | 83,704 | ||||||||||||||||||||||||
| Provision for credit losses | 2,606 | 65 | 4,965 | 3,158 | 36,820 | ||||||||||||||||||||||||
| Net interest income after provision for credit losses | 92,534 | 92,135 | 82,279 | 83,536 | 46,884 | ||||||||||||||||||||||||
| Noninterest income | |||||||||||||||||||||||||||||
| Insurance commission and fee income | 7,335 | 6,883 | 9,597 | 5,931 | 6,598 | ||||||||||||||||||||||||
| Service charges and fees | 5,324 | 5,334 | 4,951 | 5,043 | 4,965 | ||||||||||||||||||||||||
| Other fee income | 2,639 | 2,321 | 2,295 | 2,128 | 2,262 | ||||||||||||||||||||||||
| Mortgage banking revenue | 591 | 848 | 563 | 680 | 726 | ||||||||||||||||||||||||
| Swap fee income | 402 | 32 | 54 | 58 | 1,387 | ||||||||||||||||||||||||
| Change in fair value of equity investments | — | — | — | — | 6,972 | ||||||||||||||||||||||||
| (Loss) gain on sales of securities, net | (30) | 1 | — | — | — | ||||||||||||||||||||||||
| Equity method investment income (loss) | 1,059 | (612) | (1,517) | 1,859 | 550 | ||||||||||||||||||||||||
| Other income | 760 | 586 | 852 | 1,037 | 2,668 | ||||||||||||||||||||||||
| Total noninterest income | 18,080 | 15,393 | 16,795 | 16,736 | 26,128 | ||||||||||||||||||||||||
| Noninterest expense | |||||||||||||||||||||||||||||
| Salaries and employee benefits | 40,521 | 40,374 | 38,397 | 37,015 | 37,863 | ||||||||||||||||||||||||
| Occupancy and equipment, net | 7,322 | 7,201 | 6,984 | 6,961 | 7,079 | ||||||||||||||||||||||||
| Data processing | 3,854 | 3,738 | 4,050 | 3,672 | 3,526 | ||||||||||||||||||||||||
| Office and operations | 3,040 | 3,174 | 2,937 | 3,243 | 3,184 | ||||||||||||||||||||||||
| Professional services | 1,266 | 1,809 | 2,649 | 2,703 | 1,395 | ||||||||||||||||||||||||
| Intangible asset amortization | 1,333 | 1,484 | 1,485 | 1,499 | 1,583 | ||||||||||||||||||||||||
| Electronic banking | 944 | 935 | 1,442 | 1,545 | 1,470 | ||||||||||||||||||||||||
| Advertising and marketing | 1,516 | 1,650 | 1,360 | 1,746 | 1,524 | ||||||||||||||||||||||||
| Regulatory assessments | 1,184 | 1,364 | 1,335 | 1,528 | 1,269 | ||||||||||||||||||||||||
| Loan-related expenses | 740 | 1,045 | 895 | 787 | 979 | ||||||||||||||||||||||||
| Other expenses | 769 | 1,638 | 2,263 | 2,124 | 2,156 | ||||||||||||||||||||||||
| Total noninterest expense | 62,489 | 64,412 | 63,797 | 62,823 | 62,028 | ||||||||||||||||||||||||
| Income before income tax expense | 48,125 | 43,116 | 35,277 | 37,449 | 10,984 | ||||||||||||||||||||||||
| Income tax expense | 10,347 | 9,270 | 7,584 | 7,933 | 2,361 | ||||||||||||||||||||||||
| Net income | $ | 37,778 | $ | 33,846 | $ | 27,693 | $ | 29,516 | $ | 8,623 | |||||||||||||||||||
11
Origin Bancorp, Inc.
Consolidated Balance Sheets
(Unaudited)
| (Dollars in thousands) | September 30, 2026 | June 30, 2026 | March 31, 2026 | December 31, 2025 | September 30, 2025 | ||||||||||||||||||||||||
| Assets | |||||||||||||||||||||||||||||
| Cash and due from banks | $ | 84,416 | $ | 87,315 | $ | 90,641 | $ | 73,122 | $ | 94,062 | |||||||||||||||||||
| Interest-bearing deposits in banks | 262,666 | 459,216 | 575,562 | 351,095 | 532,847 | ||||||||||||||||||||||||
| Total cash and cash equivalents | 347,082 | 546,531 | 666,203 | 424,217 | 626,909 | ||||||||||||||||||||||||
| Securities: | |||||||||||||||||||||||||||||
| AFS | 1,117,665 | 1,142,223 | 1,151,402 | 1,117,176 | 1,104,789 | ||||||||||||||||||||||||
| Held to maturity, net of allowance for credit losses | 22,493 | 10,557 | 10,557 | 10,559 | 10,559 | ||||||||||||||||||||||||
| Securities carried at fair value through income | 5,836 | 5,872 | 6,197 | 6,215 | 6,203 | ||||||||||||||||||||||||
| Total securities | 1,145,994 | 1,158,652 | 1,168,156 | 1,133,950 | 1,121,551 | ||||||||||||||||||||||||
| Non-marketable equity securities held in other financial institutions | 33,136 | 37,662 | 31,193 | 31,069 | 31,041 | ||||||||||||||||||||||||
| Equity method investments | 64,168 | 63,141 | 66,091 | 67,502 | 65,643 | ||||||||||||||||||||||||
| Loans held for sale | 628 | 1,146 | 2,935 | 1,032 | 312 | ||||||||||||||||||||||||
| LHFI | 8,094,172 | 8,073,577 | 7,864,221 | 7,670,917 | 7,537,099 | ||||||||||||||||||||||||
| Less: ALCL | 98,378 | 98,188 | 99,015 | 96,782 | 96,259 | ||||||||||||||||||||||||
| LHFI, net of ALCL | 7,995,794 | 7,975,389 | 7,765,206 | 7,574,135 | 7,440,840 | ||||||||||||||||||||||||
| Premises and equipment, net | 134,673 | 133,783 | 126,916 | 124,249 | 122,899 | ||||||||||||||||||||||||
| Cash surrender value of bank-owned life insurance | 42,466 | 42,215 | 41,968 | 41,726 | 41,478 | ||||||||||||||||||||||||
| Goodwill | 128,679 | 128,679 | 128,679 | 128,679 | 128,679 | ||||||||||||||||||||||||
| Other intangible assets, net | 29,059 | 30,393 | 31,877 | 33,362 | 34,861 | ||||||||||||||||||||||||
| Accrued interest receivable and other assets | 183,435 | 159,339 | 158,920 | 164,801 | 177,093 | ||||||||||||||||||||||||
| Total assets | $ | 10,105,114 | $ | 10,276,930 | $ | 10,188,144 | $ | 9,724,722 | $ | 9,791,306 | |||||||||||||||||||
| Liabilities and Shareholders’ Equity | |||||||||||||||||||||||||||||
| Noninterest-bearing deposits | $ | 2,176,440 | $ | 2,260,015 | $ | 2,062,982 | $ | 1,979,875 | $ | 2,000,324 | |||||||||||||||||||
| Interest-bearing deposits | 5,727,032 | 5,684,879 | 5,895,932 | 5,497,920 | 5,516,821 | ||||||||||||||||||||||||
| Time deposits | 769,702 | 758,357 | 797,354 | 829,452 | 814,685 | ||||||||||||||||||||||||
| Total deposits | 8,673,174 | 8,703,251 | 8,756,268 | 8,307,247 | 8,331,830 | ||||||||||||||||||||||||
| FHLB advances and other borrowings | 15,377 | 136,878 | 12,609 | 19,050 | 12,790 | ||||||||||||||||||||||||
| Subordinated indebtedness | 16,619 | 16,594 | 16,569 | 16,544 | 89,715 | ||||||||||||||||||||||||
| Accrued expenses and other liabilities | 136,257 | 139,150 | 142,423 | 135,196 | 142,215 | ||||||||||||||||||||||||
| Total liabilities | 8,841,427 | 8,995,873 | 8,927,869 | 8,478,037 | 8,576,550 | ||||||||||||||||||||||||
| Shareholders’ equity: | |||||||||||||||||||||||||||||
Common stock | 153,014 | 154,252 | 154,397 | 154,762 | 154,839 | ||||||||||||||||||||||||
| Additional paid-in capital | 526,652 | 530,959 | 532,773 | 533,541 | 532,975 | ||||||||||||||||||||||||
| Retained earnings | 680,431 | 656,674 | 633,949 | 612,523 | 588,106 | ||||||||||||||||||||||||
| Accumulated other comprehensive loss | (96,410) | (60,828) | (60,844) | (54,141) | (61,164) | ||||||||||||||||||||||||
| Total shareholders’ equity | 1,263,687 | 1,281,057 | 1,260,275 | 1,246,685 | 1,214,756 | ||||||||||||||||||||||||
| Total liabilities and shareholders’ equity | $ | 10,105,114 | $ | 10,276,930 | $ | 10,188,144 | $ | 9,724,722 | $ | 9,791,306 | |||||||||||||||||||
12
Origin Bancorp, Inc.
Loan Data
(Unaudited)
| At and For the Three Months Ended | |||||||||||||||||||||||||||||
| September 30, 2026 | June 30, 2026 | March 31, 2026 | December 31, 2025 | September 30, 2025 | |||||||||||||||||||||||||
| LHFI | (Dollars in thousands) | ||||||||||||||||||||||||||||
| Owner-occupied commercial real estate | $ | 1,115,338 | $ | 1,048,534 | $ | 999,440 | $ | 1,004,801 | $ | 986,859 | |||||||||||||||||||
| Non-owner-occupied commercial real estate | 1,607,135 | 1,583,170 | 1,511,138 | 1,519,104 | 1,520,020 | ||||||||||||||||||||||||
| Construction/land/land development | 776,682 | 698,610 | 641,273 | 611,220 | 615,778 | ||||||||||||||||||||||||
| Single-family residential real estate | 1,437,148 | 1,425,285 | 1,442,792 | 1,444,611 | 1,460,696 | ||||||||||||||||||||||||
| Multifamily residential real estate | 577,102 | 568,445 | 555,527 | 553,149 | 540,601 | ||||||||||||||||||||||||
| Total real estate loans | 5,513,405 | 5,324,044 | 5,150,170 | 5,132,885 | 5,123,954 | ||||||||||||||||||||||||
| Commercial and industrial | 2,122,572 | 2,141,623 | 2,173,126 | 1,989,218 | 1,919,782 | ||||||||||||||||||||||||
| Mortgage warehouse lines of credit | 439,677 | 589,706 | 522,290 | 528,781 | 472,968 | ||||||||||||||||||||||||
| Consumer | 18,518 | 18,204 | 18,635 | 20,033 | 20,395 | ||||||||||||||||||||||||
| Total LHFI | 8,094,172 | 8,073,577 | 7,864,221 | 7,670,917 | 7,537,099 | ||||||||||||||||||||||||
| Less: ALCL | 98,378 | 98,188 | 99,015 | 96,782 | 96,259 | ||||||||||||||||||||||||
| LHFI, net | $ | 7,995,794 | $ | 7,975,389 | $ | 7,765,206 | $ | 7,574,135 | $ | 7,440,840 | |||||||||||||||||||
Nonperforming assets(1) | |||||||||||||||||||||||||||||
| Nonperforming LHFI | |||||||||||||||||||||||||||||
| Commercial real estate | $ | 9,773 | $ | 15,479 | $ | 19,891 | $ | 13,212 | $ | 11,736 | |||||||||||||||||||
| Construction/land/land development | 15,319 | 16,365 | 19,427 | 16,388 | 17,047 | ||||||||||||||||||||||||
| Single-family residential real estate | 37,100 | 35,595 | 37,809 | 39,480 | 41,964 | ||||||||||||||||||||||||
| Multifamily residential real estate | — | — | — | — | 2,404 | ||||||||||||||||||||||||
| Commercial and industrial | 10,213 | 11,015 | 10,074 | 11,919 | 15,043 | ||||||||||||||||||||||||
| Consumer | 56 | 68 | 65 | 185 | 88 | ||||||||||||||||||||||||
| Total nonperforming LHFI | 72,461 | 78,522 | 87,266 | 81,184 | 88,282 | ||||||||||||||||||||||||
| Other real estate owned/repossessed assets | 2,641 | 759 | 1,007 | 694 | 577 | ||||||||||||||||||||||||
| Total nonperforming assets | $ | 75,102 | $ | 79,281 | $ | 88,273 | $ | 81,878 | $ | 88,859 | |||||||||||||||||||
| Classified assets | $ | 148,679 | $ | 144,410 | $ | 154,599 | $ | 148,322 | $ | 138,910 | |||||||||||||||||||
| Past due 30 to 89 days and still accruing | $ | 10,308 | 5,203 | 17,624 | 14,764 | 7,739 | |||||||||||||||||||||||
| Allowance for loan credit losses | |||||||||||||||||||||||||||||
| Balance at beginning of period | $ | 98,188 | $ | 99,015 | $ | 96,782 | $ | 96,259 | $ | 92,426 | |||||||||||||||||||
| Provision for loan credit losses | 2,851 | (373) | 5,010 | 3,693 | 35,216 | ||||||||||||||||||||||||
| Loans charged off | 3,224 | 2,496 | 3,963 | 4,328 | 32,206 | ||||||||||||||||||||||||
| Loan recoveries | 563 | 2,042 | 1,186 | 1,158 | 823 | ||||||||||||||||||||||||
| Net charge-offs | 2,661 | 454 | 2,777 | 3,170 | 31,383 | ||||||||||||||||||||||||
| Balance at end of period | $ | 98,378 | $ | 98,188 | $ | 99,015 | $ | 96,782 | $ | 96,259 | |||||||||||||||||||
13
Origin Bancorp, Inc.
Loan Data - Continued
(Unaudited)
| At and For the Three Months Ended | |||||||||||||||||||||||||||||
| September 30, 2026 | June 30, 2026 | March 31, 2026 | December 31, 2025 | September 30, 2025 | |||||||||||||||||||||||||
| Credit quality ratios | |||||||||||||||||||||||||||||
| Total nonperforming assets to total assets | 0.74 | % | 0.77 | % | 0.87 | % | 0.84 | % | 0.91 | % | |||||||||||||||||||
| Total nonperforming assets to loans & OREO | 0.93 | 0.98 | 1.12 | 1.07 | 1.18 | ||||||||||||||||||||||||
| Nonperforming LHFI to LHFI | 0.90 | 0.97 | 1.11 | 1.06 | 1.17 | ||||||||||||||||||||||||
| Past due 30 to 89 days and still accruing to LHFI | 0.13 | 0.06 | 0.22 | 0.19 | 0.10 | ||||||||||||||||||||||||
| ALCL to nonperforming LHFI | 135.77 | 125.05 | 113.46 | 119.21 | 109.04 | ||||||||||||||||||||||||
| ALCL to total LHFI | 1.22 | 1.22 | 1.26 | 1.26 | 1.28 | ||||||||||||||||||||||||
ALCL to total LHFI excl. mortgage warehouse lines of credit (2) | 1.27 | 1.30 | 1.34 | 1.34 | 1.35 | ||||||||||||||||||||||||
| Net charge-offs to total average LHFI (annualized) | 0.13 | 0.02 | 0.15 | 0.17 | 1.65 | ||||||||||||||||||||||||
____________________________
(1)Nonperforming assets consist of nonperforming/nonaccrual loans and property acquired through foreclosures or repossession, as well as bank-owned property not in use and listed for sale, if any.
(2)The ALCL to total LHFI excl. mortgage warehouse lines of credit, is calculated by excluding the ALCL for mortgage warehouse lines of credit loans from the total LHFI ALCL in the numerator and excluding the mortgage warehouse lines of credit loans from the LHFI in the denominator. Due to their low-risk profile, mortgage warehouse lines of credit loans require a disproportionately low allocation of the ALCL.
14
Origin Bancorp, Inc.
Average Balances and Yields/Rates
(Unaudited)
| Three Months Ended | |||||||||||||||||||||||||||||||||||||||||||||||||||||
| September 30, 2026 | June 30, 2026 | September 30, 2025 | |||||||||||||||||||||||||||||||||||||||||||||||||||
| Average Balance | Income/Expense | Yield/Rate(1) | Average Balance | Income/Expense | Yield/Rate(1) | Average Balance | Income/Expense | Yield/Rate(1) | |||||||||||||||||||||||||||||||||||||||||||||
| Assets | (Dollars in thousands) | ||||||||||||||||||||||||||||||||||||||||||||||||||||
| Commercial real estate | $ | 2,643,416 | $ | 39,273 | 5.89 | % | $ | 2,563,643 | $ | 37,196 | 5.82 | % | $ | 2,450,148 | $ | 36,101 | 5.85 | % | |||||||||||||||||||||||||||||||||||
| Construction/land/land development | 742,095 | 12,654 | 6.77 | 675,151 | 11,603 | 6.89 | 644,455 | 11,454 | 7.05 | ||||||||||||||||||||||||||||||||||||||||||||
| Single-family residential real estate | 1,432,824 | 19,917 | 5.51 | 1,428,511 | 19,627 | 5.51 | 1,460,412 | 20,004 | 5.43 | ||||||||||||||||||||||||||||||||||||||||||||
| Multifamily residential real estate | 578,468 | 9,086 | 6.23 | 572,052 | 8,688 | 6.09 | 532,354 | 8,428 | 6.28 | ||||||||||||||||||||||||||||||||||||||||||||
| Commercial and industrial ("C&I") | 2,164,704 | 36,393 | 6.67 | 2,212,814 | 36,675 | 6.65 | 1,994,755 | 36,283 | 7.22 | ||||||||||||||||||||||||||||||||||||||||||||
| Mortgage warehouse lines of credit | 479,308 | 7,776 | 6.44 | 483,340 | 7,685 | 6.38 | 420,848 | 7,393 | 6.97 | ||||||||||||||||||||||||||||||||||||||||||||
| Consumer | 18,859 | 336 | 7.07 | 19,158 | 351 | 7.35 | 20,652 | 385 | 7.40 | ||||||||||||||||||||||||||||||||||||||||||||
| LHFI | 8,059,674 | 125,435 | 6.17 | 7,954,669 | 121,825 | 6.14 | 7,523,624 | 120,048 | 6.33 | ||||||||||||||||||||||||||||||||||||||||||||
| Loans held for sale | 1,201 | 23 | 7.60 | 2,161 | 32 | 5.94 | 2,918 | 48 | 6.53 | ||||||||||||||||||||||||||||||||||||||||||||
| Loans receivable | 8,060,875 | 125,458 | 6.17 | 7,956,830 | 121,857 | 6.14 | 7,526,542 | 120,096 | 6.33 | ||||||||||||||||||||||||||||||||||||||||||||
| Investment securities-taxable | 969,386 | 8,844 | 3.62 | 992,478 | 9,039 | 3.65 | 951,758 | 8,767 | 3.65 | ||||||||||||||||||||||||||||||||||||||||||||
| Investment securities-nontaxable | 196,079 | 1,632 | 3.30 | 185,851 | 1,517 | 3.27 | 176,051 | 1,523 | 3.43 | ||||||||||||||||||||||||||||||||||||||||||||
| Non-marketable equity securities held in other financial institutions | 37,256 | 574 | 6.11 | 39,526 | 392 | 3.98 | 34,652 | 542 | 6.21 | ||||||||||||||||||||||||||||||||||||||||||||
| Interest-earning balances due from banks | 375,478 | 3,527 | 3.73 | 309,510 | 2,918 | 3.78 | 473,352 | 5,211 | 4.37 | ||||||||||||||||||||||||||||||||||||||||||||
| Total interest-earning assets | 9,639,074 | 140,035 | 5.76 | 9,484,195 | 135,723 | 5.74 | 9,162,355 | 136,139 | 5.89 | ||||||||||||||||||||||||||||||||||||||||||||
| Noninterest-earning assets | 554,817 | 555,512 | 565,059 | ||||||||||||||||||||||||||||||||||||||||||||||||||
| Total assets | $ | 10,193,891 | $ | 10,039,707 | $ | 9,727,414 | |||||||||||||||||||||||||||||||||||||||||||||||
| Liabilities and Shareholders’ Equity | |||||||||||||||||||||||||||||||||||||||||||||||||||||
| Liabilities | |||||||||||||||||||||||||||||||||||||||||||||||||||||
| Interest-bearing liabilities | |||||||||||||||||||||||||||||||||||||||||||||||||||||
| Interest-bearing demand deposits | $ | 1,812,819 | $ | 10,883 | 2.38 | % | $ | 1,892,759 | $ | 11,051 | 2.34 | % | $ | 1,827,758 | $ | 13,170 | 2.86 | % | |||||||||||||||||||||||||||||||||||
| Money market deposits | 3,637,422 | 26,427 | 2.88 | 3,420,399 | 24,491 | 2.87 | 3,369,582 | 29,695 | 3.50 | ||||||||||||||||||||||||||||||||||||||||||||
| Savings deposits | 309,898 | 918 | 1.18 | 304,088 | 866 | 1.14 | 314,112 | 1,194 | 1.51 | ||||||||||||||||||||||||||||||||||||||||||||
| Savings and interest-bearing transaction accounts | 5,760,139 | 38,228 | 2.63 | 5,617,246 | 36,408 | 2.60 | 5,511,452 | 44,059 | 3.17 | ||||||||||||||||||||||||||||||||||||||||||||
| Time deposits | 764,344 | 5,880 | 3.05 | 765,794 | 5,593 | 2.93 | 819,692 | 6,967 | 3.37 | ||||||||||||||||||||||||||||||||||||||||||||
| Total interest-bearing deposits | 6,524,483 | 44,108 | 2.68 | 6,383,040 | 42,001 | 2.64 | 6,331,144 | 51,026 | 3.20 | ||||||||||||||||||||||||||||||||||||||||||||
| FHLB advances and other borrowings | 57,246 | 543 | 3.76 | 140,897 | 1,283 | 3.65 | 30,702 | 273 | 3.53 | ||||||||||||||||||||||||||||||||||||||||||||
| Subordinated indebtedness | 16,608 | 244 | 5.83 | 16,582 | 239 | 5.78 | 89,692 | 1,136 | 5.02 | ||||||||||||||||||||||||||||||||||||||||||||
| Total interest-bearing liabilities | 6,598,337 | 44,895 | 2.70 | 6,540,519 | 43,523 | 2.67 | 6,451,538 | 52,435 | 3.22 | ||||||||||||||||||||||||||||||||||||||||||||
| Noninterest-bearing liabilities | |||||||||||||||||||||||||||||||||||||||||||||||||||||
| Noninterest-bearing deposits | 2,160,353 | 2,080,382 | 1,901,116 | ||||||||||||||||||||||||||||||||||||||||||||||||||
| Other liabilities | 147,406 | 143,422 | 147,329 | ||||||||||||||||||||||||||||||||||||||||||||||||||
| Total liabilities | 8,906,096 | 8,764,323 | 8,499,983 | ||||||||||||||||||||||||||||||||||||||||||||||||||
| Shareholders’ Equity | 1,287,795 | 1,275,384 | 1,227,431 | ||||||||||||||||||||||||||||||||||||||||||||||||||
| Total liabilities and shareholders’ equity | $ | 10,193,891 | $ | 10,039,707 | $ | 9,727,414 | |||||||||||||||||||||||||||||||||||||||||||||||
| Net interest spread | 3.06 | % | 3.07 | % | 2.67 | % | |||||||||||||||||||||||||||||||||||||||||||||||
| NIM | $ | 95,140 | 3.92 | $ | 92,200 | 3.90 | $ | 83,704 | 3.62 | ||||||||||||||||||||||||||||||||||||||||||||
NIM-FTE(2) | $ | 95,628 | 3.94 | $ | 92,668 | 3.92 | $ | 84,230 | 3.65 | ||||||||||||||||||||||||||||||||||||||||||||
____________________________
(1)Yields/Rates are calculated on an actual/actual day count basis.
(2)In order to present pre-tax income and resulting yields on tax-exempt investments comparable to those on taxable investments, a tax-equivalent adjustment has been computed. This adjustment also includes income tax credits received on Qualified School Construction Bonds.
15
Origin Bancorp, Inc.
Notable Items
(Unaudited)
| At and For the Three Months Ended | |||||||||||||||||||||||||||||||||||||||||||||||||||||||||||
| September 30, 2026 | June 30, 2026 | March 31, 2026 | December 31, 2025 | September 30, 2025 | |||||||||||||||||||||||||||||||||||||||||||||||||||||||
| $ Impact | EPS Impact(1) | $ Impact | EPS Impact(1) | $ Impact | EPS Impact(1) | $ Impact | EPS Impact(1) | $ Impact | EPS Impact(1) | ||||||||||||||||||||||||||||||||||||||||||||||||||
| (Dollars in thousands, except per share amounts) | |||||||||||||||||||||||||||||||||||||||||||||||||||||||||||
| Notable interest income items: | |||||||||||||||||||||||||||||||||||||||||||||||||||||||||||
| Interest income reversal related to borrower fraud | $ | — | $ | — | $ | — | $ | — | $ | — | $ | — | $ | — | $ | — | $ | (206) | $ | (0.01) | |||||||||||||||||||||||||||||||||||||||
| Interest income on relationships impacted by questioned banker activity | 131 | — | — | — | — | — | — | — | — | — | |||||||||||||||||||||||||||||||||||||||||||||||||
| Notable interest expense items: | |||||||||||||||||||||||||||||||||||||||||||||||||||||||||||
| OID amortization - subordinated debenture redemption | — | — | — | — | — | — | (783) | (0.02) | — | — | |||||||||||||||||||||||||||||||||||||||||||||||||
| Notable provision expense items: | |||||||||||||||||||||||||||||||||||||||||||||||||||||||||||
| Provision release (expense) on relationships related to or impacted by questioned banker activity | 992 | 0.03 | 18 | — | — | — | (10) | — | (1,670) | (0.04) | |||||||||||||||||||||||||||||||||||||||||||||||||
| Provision expense related to borrower fraud | — | — | — | — | — | — | (13) | — | (29,545) | (0.74) | |||||||||||||||||||||||||||||||||||||||||||||||||
| Notable noninterest income items: | |||||||||||||||||||||||||||||||||||||||||||||||||||||||||||
| (Loss) gain on sales of securities, net | (30) | — | 1 | — | — | — | — | — | — | — | |||||||||||||||||||||||||||||||||||||||||||||||||
| Positive valuation adjustment on non-marketable equity securities | — | — | — | — | — | — | — | — | 6,972 | 0.18 | |||||||||||||||||||||||||||||||||||||||||||||||||
| Insurance recovery income related to questioned banker activity | 157 | — | — | — | 438 | 0.01 | 483 | 0.01 | 2,077 | 0.05 | |||||||||||||||||||||||||||||||||||||||||||||||||
| Notable noninterest expense items: | |||||||||||||||||||||||||||||||||||||||||||||||||||||||||||
Operating benefit (expense) related to questioned banker activity(2) | 1,204 | 0.03 | 325 | 0.01 | (542) | (0.01) | (698) | (0.02) | (112) | — | |||||||||||||||||||||||||||||||||||||||||||||||||
Operating expense related to strategic Optimize Origin initiatives(3) | — | — | — | — | — | — | (51) | — | (577) | (0.01) | |||||||||||||||||||||||||||||||||||||||||||||||||
| Operating expense related to borrower fraud | (347) | (0.01) | (458) | (0.01) | (473) | (0.01) | (587) | (0.01) | (285) | (0.01) | |||||||||||||||||||||||||||||||||||||||||||||||||
| Total notable items | $ | 2,107 | 0.05 | $ | (114) | — | $ | (577) | (0.01) | $ | (1,659) | (0.04) | $ | (23,346) | (0.59) | ||||||||||||||||||||||||||||||||||||||||||||
____________________________
(1)The diluted EPS impact is calculated using a 21% effective tax rate. The total of the diluted EPS impact of each individual line item may not equal the calculated diluted EPS impact on the total notable items due to rounding.
(2)The $1.2 million and $325,000 operating net benefit related to questioned banker activity for the quarter ended September 30, 2026 and June 30, 2026, include $2.2 million and $389,000 release of litigation reserve, respectively.
(3)Operating expenses related to strategic Optimize Origin initiatives are expected to be immaterial and, accordingly, will no longer be separately tracked beginning with the quarter ended March 31, 2026. The $51,000 and $577,000 operating expenses related to strategic Optimize Origin initiatives for the quarters ended December 31, 2025, and September 30, 2025, include sub-lease income of $40,000 and $27,000, respectively, that was included in noninterest income on the face of the income statement.
16
Origin Bancorp, Inc.
Notable Items - Continued
(Unaudited)
| Nine Months Ended September 30, | |||||||||||||||||||||||
| 2026 | 2025 | ||||||||||||||||||||||
| $ Impact | EPS Impact(1) | $ Impact | EPS Impact(1) | ||||||||||||||||||||
| (Dollars in thousands, except per share amounts) | |||||||||||||||||||||||
| Notable interest income items: | |||||||||||||||||||||||
| Interest income reversal related to borrower fraud | $ | — | $ | — | $ | (206) | $ | (0.01) | |||||||||||||||
| Interest income on relationships impacted by questioned banker activity | 131 | — | — | — | |||||||||||||||||||
| Notable interest expense items: | |||||||||||||||||||||||
| OID amortization - subordinated debenture redemption | — | — | (681) | (0.02) | |||||||||||||||||||
| Notable provision expense items: | |||||||||||||||||||||||
| Provision release on relationships related to or impacted by questioned banker activity | 1,010 | 0.03 | (1,295) | (0.03) | |||||||||||||||||||
| Provision expense related to borrower fraud | — | — | (29,545) | (0.74) | |||||||||||||||||||
| Notable noninterest income items: | |||||||||||||||||||||||
| Loss on sales of securities, net | (29) | — | (14,448) | (0.36) | |||||||||||||||||||
| Positive valuation adjustment on non-marketable equity securities | — | — | 6,972 | 0.18 | |||||||||||||||||||
Net loss on OREO properties(2) | — | — | (370) | (0.01) | |||||||||||||||||||
| BOLI payout | — | — | 208 | 0.01 | |||||||||||||||||||
| Insurance recovery income related to questioned banker activity | 595 | 0.02 | 2,077 | 0.05 | |||||||||||||||||||
| Notable noninterest expense items: | |||||||||||||||||||||||
Operating benefit (expense) related to questioned banker activity(3) | 987 | 0.03 | (1,185) | (0.03) | |||||||||||||||||||
Operating expense related to strategic Optimize Origin initiatives(4) | — | — | (2,620) | (0.07) | |||||||||||||||||||
| Operating expense related to borrower fraud | (1,278) | (0.03) | (285) | (0.01) | |||||||||||||||||||
| Employee Retention Credit | — | — | 213 | 0.01 | |||||||||||||||||||
| Total notable items | $ | 1,416 | 0.04 | $ | (41,165) | (1.04) | |||||||||||||||||
____________________________
(1)The diluted EPS impact is calculated using a 21% effective tax rate. The total of the diluted EPS impact of each individual line item may not equal the calculated diluted EPS impact on the total notable items due to rounding.
(2)The $370,000 net loss on OREO properties for the nine months ended September 30, 2025, includes a $452,000 insurance settlement recovery that was included in noninterest income on the face of the income statement and a $151,000 repair cost that was included in noninterest expense.
(3)The $987,000 operating expense related to questioned banker activity for the nine months ended September 30, 2026, includes a $2.6 million release of litigation reserve.
(4)Operating expenses related to strategic Optimize Origin initiatives are expected to be immaterial and accordingly, will no longer be separately tracked beginning with the quarter ended March 31, 2026. The $2.6 million operating expense related to strategic Optimize Origin initiatives for the nine months ended September 30, 2025, includes sub-lease income of $27,000 that was included in noninterest income on the face of the income statement.
17
Origin Bancorp, Inc.
Non-GAAP Financial Measures
(Unaudited)
| At and For the Three Months Ended | |||||||||||||||||||||||||||||
| September 30, 2026 | June 30, 2026 | March 31, 2026 | December 31, 2025 | September 30, 2025 | |||||||||||||||||||||||||
| (Dollars in thousands, except per share amounts) | |||||||||||||||||||||||||||||
| Calculation of PTPP earnings: | |||||||||||||||||||||||||||||
| Net income | $ | 37,778 | $ | 33,846 | $ | 27,693 | $ | 29,516 | $ | 8,623 | |||||||||||||||||||
| Provision for credit losses | 2,606 | 65 | 4,965 | 3,158 | 36,820 | ||||||||||||||||||||||||
| Income tax expense | 10,347 | 9,270 | 7,584 | 7,933 | 2,361 | ||||||||||||||||||||||||
| PTPP earnings (non-GAAP) | $ | 50,731 | $ | 43,181 | $ | 40,242 | $ | 40,607 | $ | 47,804 | |||||||||||||||||||
| Calculation of PTPP ROAA: | |||||||||||||||||||||||||||||
| PTPP earnings | $ | 50,731 | $ | 43,181 | $ | 40,242 | $ | 40,607 | $ | 47,804 | |||||||||||||||||||
| Divided by number of days in the quarter | 92 | 91 | 90 | 92 | 92 | ||||||||||||||||||||||||
| Multiplied by the number of days in the year | 365 | 365 | 365 | 365 | 365 | ||||||||||||||||||||||||
| PTPP earnings, annualized | $ | 201,270 | $ | 173,199 | $ | 163,204 | $ | 161,104 | $ | 189,657 | |||||||||||||||||||
| Divided by total average assets | 10,193,891 | 10,039,707 | 10,126,491 | 9,829,752 | 9,727,414 | ||||||||||||||||||||||||
| ROAA (annualized) (GAAP) | 1.47 | % | 1.35 | % | 1.11 | % | 1.19 | % | 0.35 | % | |||||||||||||||||||
| PTPP ROAA (annualized) (non-GAAP) | 1.97 | 1.73 | 1.61 | 1.64 | 1.95 | ||||||||||||||||||||||||
| Calculation of tangible book value per common share: | |||||||||||||||||||||||||||||
| Total common shareholders’ equity | $ | 1,263,687 | $ | 1,281,057 | $ | 1,260,275 | $ | 1,246,685 | $ | 1,214,756 | |||||||||||||||||||
| Goodwill | (128,679) | (128,679) | (128,679) | (128,679) | (128,679) | ||||||||||||||||||||||||
| Other intangible assets, net | (29,059) | (30,393) | (31,877) | (33,362) | (34,861) | ||||||||||||||||||||||||
| Tangible common equity | 1,105,949 | 1,121,985 | 1,099,719 | 1,084,644 | 1,051,216 | ||||||||||||||||||||||||
| Divided by common shares outstanding at the end of the period | 30,602,833 | 30,850,397 | 30,879,462 | 30,952,428 | 30,967,768 | ||||||||||||||||||||||||
| Book value per common share (GAAP) | $ | 41.29 | $ | 41.52 | $ | 40.81 | $ | 40.28 | $ | 39.23 | |||||||||||||||||||
| Tangible book value per common share (non-GAAP) | 36.14 | 36.37 | 35.61 | 35.04 | 33.95 | ||||||||||||||||||||||||
| Calculation of ROATCE: | |||||||||||||||||||||||||||||
| Net income | $ | 37,778 | $ | 33,846 | $ | 27,693 | $ | 29,516 | $ | 8,623 | |||||||||||||||||||
| Divided by number of days in the quarter | 92 | 91 | 90 | 92 | 92 | ||||||||||||||||||||||||
| Multiplied by number of days in the year | 365 | 365 | 365 | 365 | 365 | ||||||||||||||||||||||||
| Annualized net income | $ | 149,880 | $ | 135,756 | $ | 112,311 | $ | 117,102 | $ | 34,211 | |||||||||||||||||||
| Total average common shareholders’ equity | $ | 1,287,795 | $ | 1,275,384 | $ | 1,267,888 | $ | 1,232,878 | $ | 1,227,431 | |||||||||||||||||||
| Average goodwill | (128,679) | (128,679) | (128,679) | (128,679) | (128,679) | ||||||||||||||||||||||||
| Average other intangible assets, net | (29,772) | (31,142) | (32,679) | (34,293) | (35,741) | ||||||||||||||||||||||||
| Average tangible common equity | 1,129,344 | 1,115,563 | 1,106,530 | 1,069,906 | 1,063,011 | ||||||||||||||||||||||||
| ROAE (annualized) (GAAP) | 11.64 | % | 10.64 | % | 8.86 | % | 9.50 | % | 2.79 | % | |||||||||||||||||||
| ROATCE (annualized) (non-GAAP) | 13.27 | 12.17 | 10.15 | 10.95 | 3.22 | ||||||||||||||||||||||||
18
Origin Bancorp, Inc.
Non-GAAP Financial Measures - Continued
(Unaudited)
| Nine Months Ended September 30, | |||||||||||
| 2026 | 2025 | ||||||||||
| (Dollars in thousands, except per share amounts) | |||||||||||
| Calculation of PTPP earnings: | |||||||||||
| Net income | $ | 99,317 | $ | 45,681 | |||||||
| Provision for credit losses | 7,636 | 43,126 | |||||||||
| Income tax expense | 27,201 | 12,511 | |||||||||
| PTPP earnings (non-GAAP) | $ | 134,154 | $ | 101,318 | |||||||
| Calculation of PTPP ROAA: | |||||||||||
| PTPP Earnings | $ | 134,154 | $ | 101,318 | |||||||
| Divided by the year-to-date number of days | 273 | 273 | |||||||||
| Multiplied by number of days in the year | 365 | 365 | |||||||||
| Annualized PTPP Earnings | $ | 179,363 | $ | 135,462 | |||||||
| Total average assets | $ | 10,120,276 | $ | 9,750,221 | |||||||
ROAA(annualized)(GAAP) | 1.31 | % | 0.63 | % | |||||||
PTPP ROAA(annualized)(non-GAAP) | 1.77 | 1.39 | |||||||||
| Calculation of ROATCE: | |||||||||||
| Net income | $ | 99,317 | $ | 45,681 | |||||||
| Divided by the year-to-date number of days | 273 | 273 | |||||||||
| Multiplied by number of days in the year | 365 | 365 | |||||||||
| Annualized net income | $ | 132,786 | $ | 61,075 | |||||||
| Total average common shareholders’ equity | $ | 1,277,095 | $ | 1,195,059 | |||||||
| Average goodwill | (128,679) | (128,679) | |||||||||
| Average other intangible assets, net | (31,187) | (37,142) | |||||||||
| Average tangible common equity | 1,117,229 | 1,029,238 | |||||||||
ROAE(annualized)(GAAP) | 10.40 | % | 5.11 | % | |||||||
ROATCE(annualized)(non-GAAP) | 11.89 | 5.93 | |||||||||
19
3Q TWENTY26 INVESTOR PRESENTATION ORIGIN BANCORP, INC.
2 FORWARD-LOOKING STATEMENTS AND NON-GAAP MEASURES This presentation contains certain forward-looking statements within the meaning of the Private Securities Litigation Reform Act of 1995. Forward-looking statements include information regarding Origin Bancorp, Inc’s (“Origin”, “we”, “our” or the “Company”) future financial performance, business and growth strategies, projected plans and objectives, and any expected purchases of its outstanding common stock, and related transactions and other projections based on macroeconomic and industry trends, including changes to interest rates by the Federal Reserve and the resulting impact on Origin’s results of operations, estimated forbearance amounts and expectations regarding the Company’s liquidity, including in connection with advances obtained from the FHLB, which are all subject to change and may be inherently unreliable due to the multiple factors that impact broader economic and industry trends, and any such changes may be material. Such forward-looking statements are based on various facts and derived utilizing important assumptions and current expectations, estimates and projections about Origin and its subsidiaries, any of which may change over time and some of which may be beyond Origin’s control. Statements or statistics preceded by, followed by or that otherwise include the words “assumes,” “anticipates,” “believes,” “estimates,” “expects,” “foresees,” “intends,” “plans,” “projects,” and similar expressions or future or conditional verbs such as “could,” “may,” “might,” “should,” “will,” and “would” and variations of such terms are generally forward-looking in nature and not historical facts, although not all forward-looking statements include the foregoing words. Further, certain factors that could affect Origin’s future results and cause actual results to differ materially from those expressed in the forward- looking statements include, but are not limited to: (1) the impact of current and future economic conditions generally and in the financial services industry, nationally and within Origin’s primary market areas, including the impact of tariffs, as well as the financial stress on borrowers and changes to customer and client behavior as a result of the foregoing; (2) changes in benchmark interest rates and the resulting impacts on net interest income; (3) deterioration of Origin’s asset quality; (4) factors that can impact the performance of Origin’s loan portfolio, including real estate values and liquidity in Origin’s primary market areas; (5) the financial health of Origin’s commercial borrowers and the success of construction projects that Origin finances; (6) changes in the value of collateral securing Origin’s loans; (7) the impact of generative artificial intelligence; (8) Origin’s ability to anticipate interest rate changes and manage interest rate risk; (9) the impact of heightened regulatory requirements, reduced debit interchange and overdraft income and the possibility of facing related adverse business consequences if our total assets grow in excess of $10 billion as of December 31 of any calendar year; (10) the effectiveness of Origin’s risk management framework and quantitative models; (11) Origin’s inability to receive dividends from Origin Bank and to service debt, pay dividends to Origin’s common shareholders, repurchase Origin’s shares of common stock and satisfy obligations as they become due; (12) the impact of labor pressures; (13) changes in Origin’s operation or expansion strategy or Origin’s ability to prudently manage its growth and execute its strategy; (14) changes in management personnel; (15) Origin’s ability to maintain important customer relationships, reputation or otherwise avoid liquidity risks; (16) increasing costs as Origin grows deposits; (17) operational risks associated with Origin’s business; (18) significant turbulence or a disruption in the capital or financial markets and the effect of market disruption and interest rate volatility on our investment securities; (19) increased competition in the financial services industry, particularly from regional and national institutions, as well as from fintech companies; (20) compliance with governmental and regulatory requirements and changes in laws, rules, regulations, interpretations or policies relating to financial institutions; (21) periodic changes to the extensive body of accounting rules and best practices; (22) further government intervention in the U.S. financial system; (23) a deterioration of the credit rating for U.S. long-term sovereign debt; (24) Origin’s ability to comply with applicable capital and liquidity requirements, including its ability to generate liquidity internally or raise capital on favorable terms, including continued access to the debt and equity capital markets; (25) natural disasters and other adverse weather events, pandemics, acts of terrorism, war, and other matters beyond Origin’s control; (26) developments in our mortgage banking business, including loan modifications, general demand, and the effects of judicial or regulatory requirements or guidance; (27) fraud or misconduct by internal or external actors (including Origin employees); (28) cybersecurity threats or security breaches and the cost of defending against them; (29) Origin’s ability to maintain adequate internal controls over financial and non-financial reporting; and (30) potential claims, damages, penalties, fines, costs and reputational damage resulting from pending or future litigation, regulatory proceedings and enforcement actions. For a discussion of these and other risks that may cause actual results to differ from expectations, please refer to the sections titled “Cautionary Note Regarding Forward-Looking Statements” and “Risk Factors” in Origin’s most recent and future Annual Reports on Form 10-K filed with the Securities and Exchange Commission and any updates to those sections set forth in Origin’s subsequent Quarterly Reports on Form 10-Q and Current Reports on Form 8-K. If one or more events related to these or other risks or uncertainties materialize, or if Origin’s underlying assumptions prove to be incorrect, actual results may differ materially from what Origin anticipates. Accordingly, you should not place undue reliance on any forward-looking statements. Any forward-looking statement speaks only as of the date on which it is made, and Origin does not undertake any obligation to publicly update or review any forward-looking statement, whether as a result of new information, future developments or otherwise. New risks and uncertainties arise from time to time, and it is not possible for Origin to predict those events or how they may affect Origin. In addition, Origin cannot assess the impact of each factor on Origin’s business or the extent to which any factor, or combination of factors, may cause actual results to differ materially from those contained in any forward-looking statements. All forward-looking statements, expressed or implied, included in this communication are expressly qualified in their entirety by this cautionary statement. This cautionary statement should also be considered in connection with any subsequent written or oral forward-looking statements that Origin or persons acting on Origin’s behalf may issue. Annualized, pro forma, adjusted, projected, and estimated numbers are used for illustrative purposes only, are not forecasts, and may not reflect actual results. This presentation contains projected financial information with respect to Origin, including with respect to certain goals and strategic initiatives of Origin and the anticipated benefits thereof. This projected financial information constitutes forward-looking information and is for illustrative purposes only and should not be relied upon as necessarily being indicative of future results. The assumptions and estimates underlying such projected financial information are inherently uncertain and are subject to significant business, economic (including interest rate), competitive, and other risks and uncertainties. Actual results may differ materially from the results contemplated by the projected financial information contained herein and the inclusion of such projected financial information in this presentation should not be regarded as a representation by any person that such actions will be taken or accomplished or that the results reflected in such projected financial information with respect thereto will be achieved. Origin reports its results in accordance with generally accepted accounting principles in the United States ("GAAP"). However, management believes that certain supplemental non-GAAP financial measures may provide meaningful information to investors that is useful in understanding Origin's results of operations and underlying trends in its business. These non-GAAP financial measures are supplemental and should be viewed in addition to, and not as an alternative for, Origin's reported results prepared in accordance with GAAP. The following are the non-GAAP measures used in this presentation: Pre-tax, pre- provision (“PTPP”) earnings, PTPP ROAA, return on average tangible common equity (“ROATCE”), tangible book value per common share, and tangible common equity to tangible assets. Please see “Reconciliation of Non-GAAP Financial Measures” at the end of this presentation for reconciliations of non-GAAP measures to the most directly comparable financial measures calculated in accordance with GAAP. ORIGIN BANCORP, INC. _______
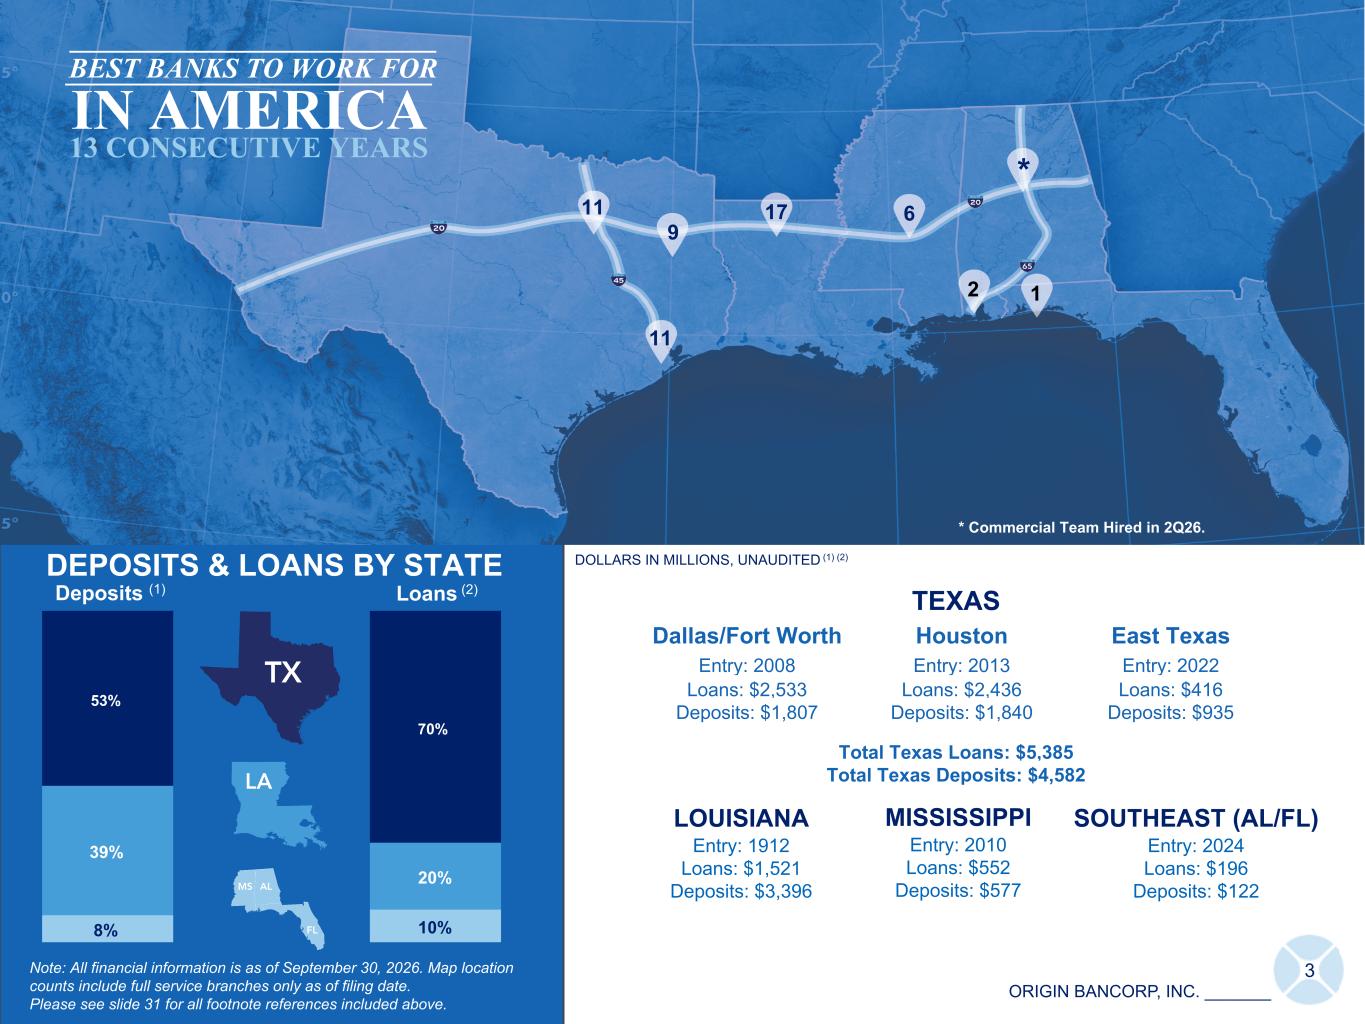
ORIGIN BANCORP, INC. _______ LOUISIANA Entry: 1912 Loans: $1,521 Deposits: $3,396 DOLLARS IN MILLIONS, UNAUDITED (1) (2) 3 DEPOSITS & LOANS BY STATE Note: All financial information is as of September 30, 2026. Map location counts include full service branches only as of filing date. Please see slide 31 for all footnote references included above. MISSISSIPPI Entry: 2010 Loans: $552 Deposits: $577 8% 10% 39% 20% 53% 70% Loans (2)Deposits (1) ICS ICS TEXAS Dallas/Fort Worth Houston East Texas Entry: 2008 Entry: 2013 Entry: 2022 Loans: $2,533 Loans: $2,436 Loans: $416 Deposits: $1,807 Deposits: $1,840 Deposits: $935 Total Texas Loans: $5,385 Total Texas Deposits: $4,582 SOUTHEAST (AL/FL) Entry: 2024 Loans: $196 Deposits: $122 11 11 9 17 6 1 BEST BANKS TO WORK FOR IN AMERICA 13 CONSECUTIVE YEARS * Commercial Team Hired in 2Q26. * 2
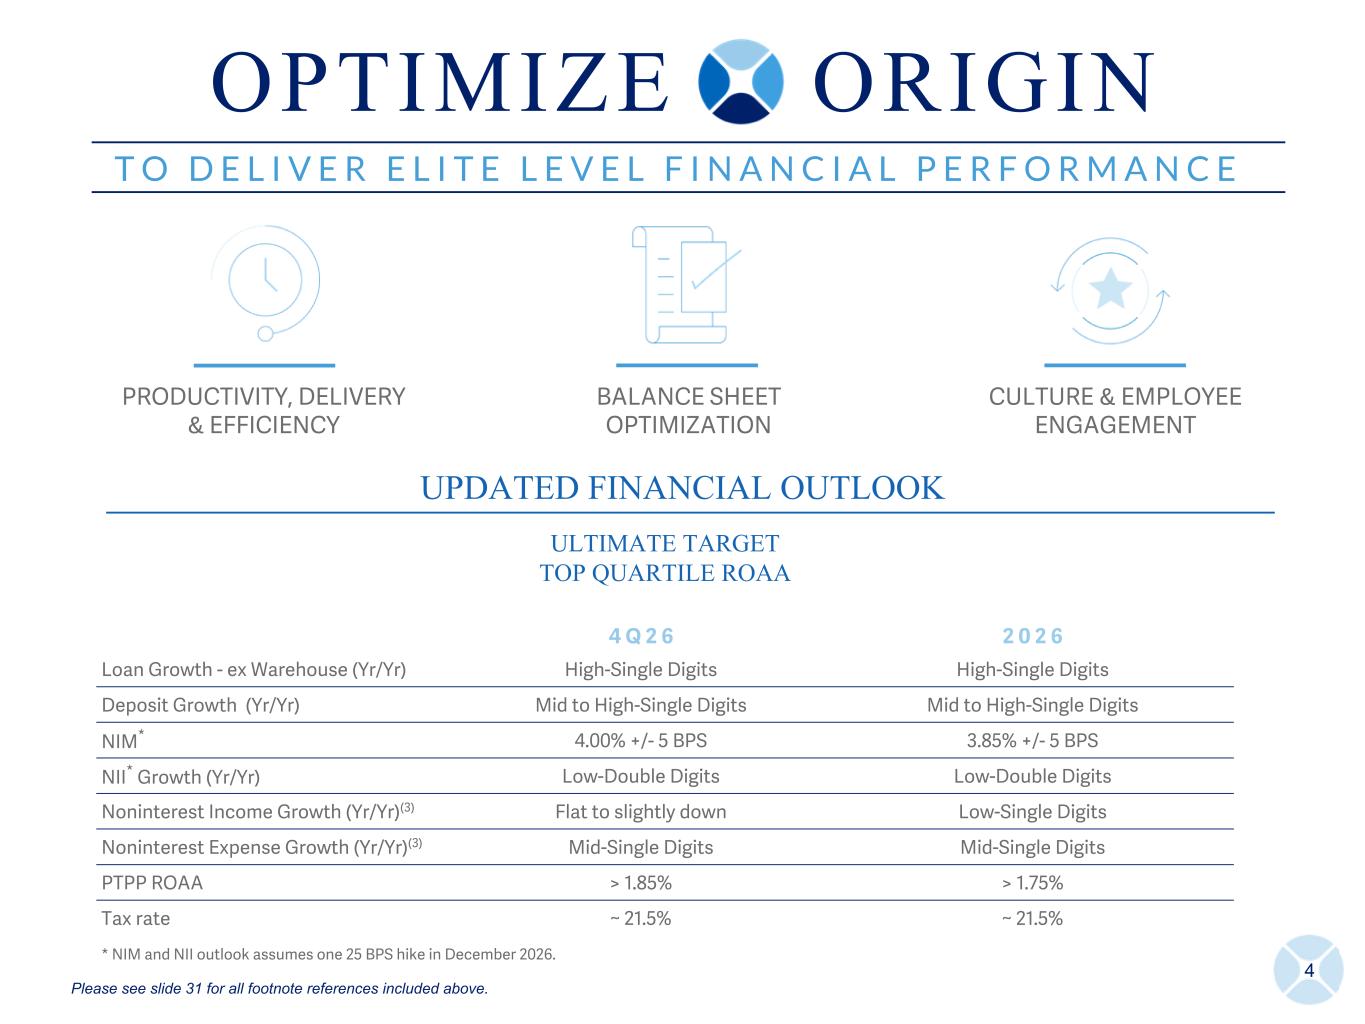
4 T O D E L I V E R E L I T E L E V E L F I N A N C I A L P E R F O R M A N C E PRODUCTIVITY, DELIVERY & EFFICIENCY BALANCE SHEET OPTIMIZATION CULTURE & EMPLOYEE ENGAGEMENT UPDATED FINANCIAL OUTLOOK 4 Q 2 6 2 0 2 6 Loan Growth - ex Warehouse (Yr/Yr) High-Single Digits High-Single Digits Deposit Growth (Yr/Yr) Mid to High-Single Digits Mid to High-Single Digits NIM* 4.00% +/- 5 BPS 3.85% +/- 5 BPS NII* Growth (Yr/Yr) Low-Double Digits Low-Double Digits Noninterest Income Growth (Yr/Yr)(3) Flat to slightly down Low-Single Digits Noninterest Expense Growth (Yr/Yr)(3) Mid-Single Digits Mid-Single Digits PTPP ROAA > 1.85% > 1.75% Tax rate ~ 21.5% ~ 21.5% * NIM and NII outlook assumes one 25 BPS hike in December 2026. ULTIMATE TARGET TOP QUARTILE ROAA O P T I M I Z E O R I G I N Please see slide 31 for all footnote references included above.
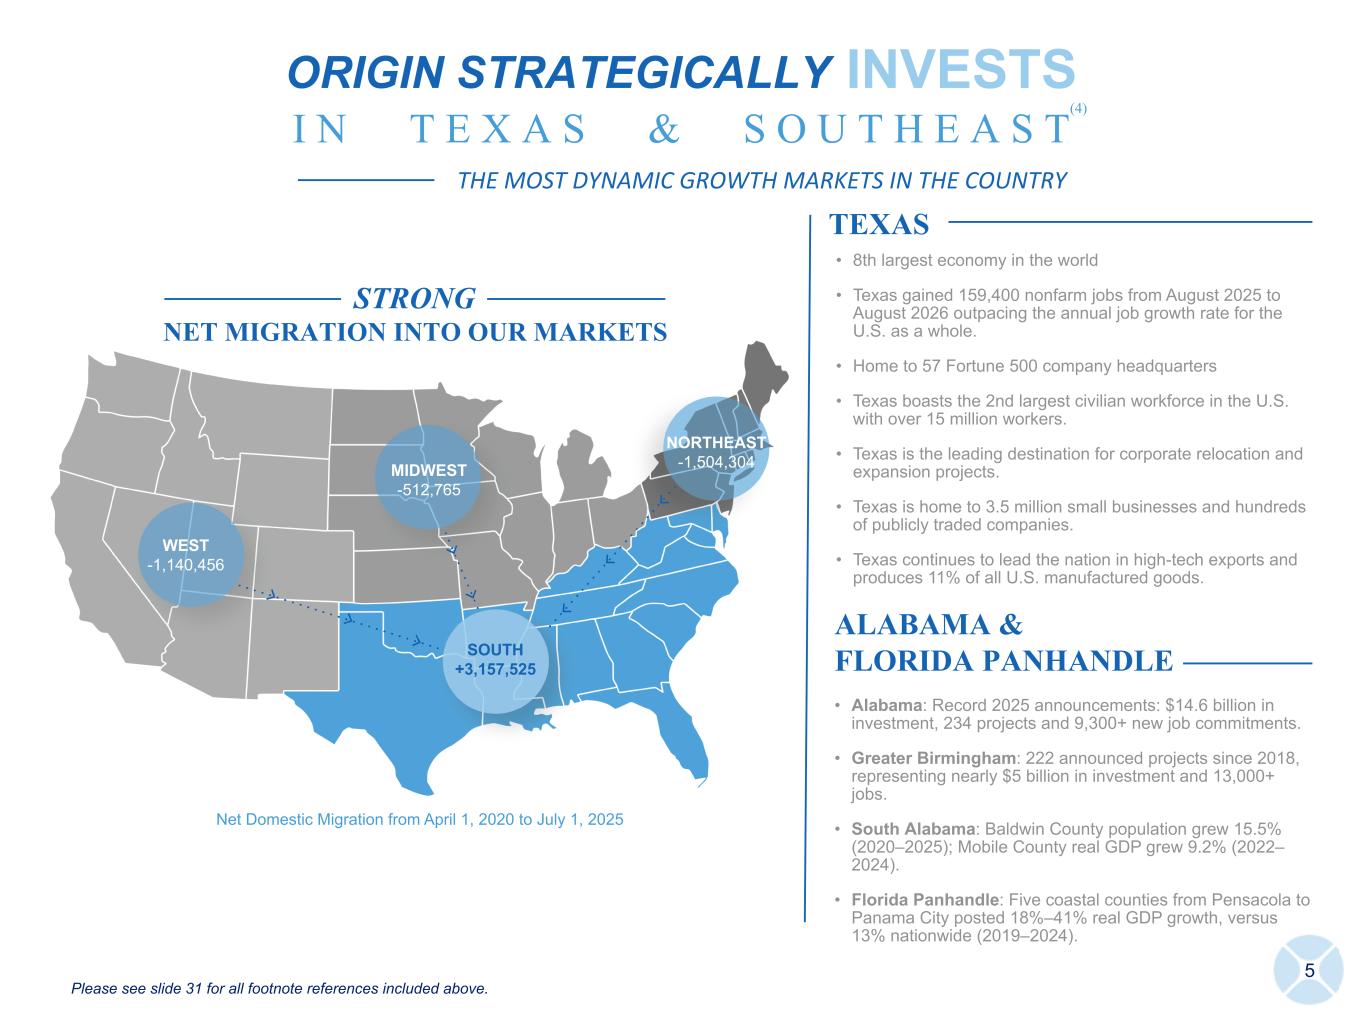
STRONG NET MIGRATION INTO OUR MARKETS WEST -1,140,456 MIDWEST -512,765 NORTHEAST -1,504,304 SOUTH +3,157,525 5 TEXAS ALABAMA & FLORIDA PANHANDLE • 8th largest economy in the world • Texas gained 159,400 nonfarm jobs from August 2025 to August 2026 outpacing the annual job growth rate for the U.S. as a whole. • Home to 57 Fortune 500 company headquarters • Texas boasts the 2nd largest civilian workforce in the U.S. with over 15 million workers. • Texas is the leading destination for corporate relocation and expansion projects. • Texas is home to 3.5 million small businesses and hundreds of publicly traded companies. • Texas continues to lead the nation in high-tech exports and produces 11% of all U.S. manufactured goods. ORIGIN STRATEGICALLY INVESTS I N T E X A S & S O U T H E A S T THE MOST DYNAMIC GROWTH MARKETS IN THE COUNTRY (4) Please see slide 31 for all footnote references included above. Net Domestic Migration from April 1, 2020 to July 1, 2025 • Alabama: Record 2025 announcements: $14.6 billion in investment, 234 projects and 9,300+ new job commitments. • Greater Birmingham: 222 announced projects since 2018, representing nearly $5 billion in investment and 13,000+ jobs. • South Alabama: Baldwin County population grew 15.5% (2020–2025); Mobile County real GDP grew 9.2% (2022– 2024). • Florida Panhandle: Five coastal counties from Pensacola to Panama City posted 18%–41% real GDP growth, versus 13% nationwide (2019–2024).
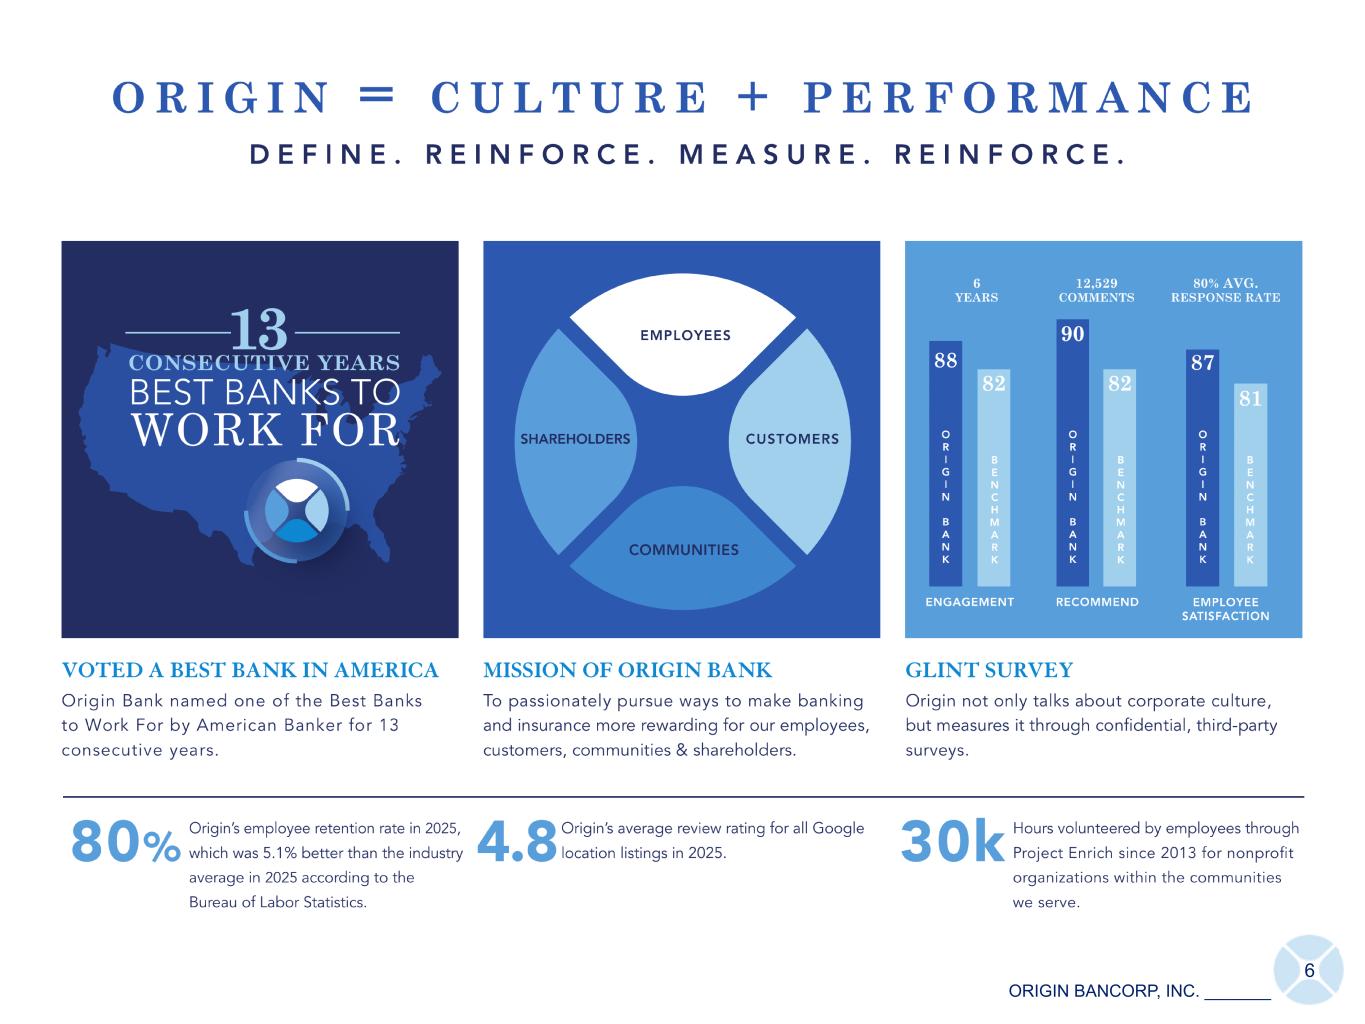
6 ORIGIN BANCORP, INC. _______
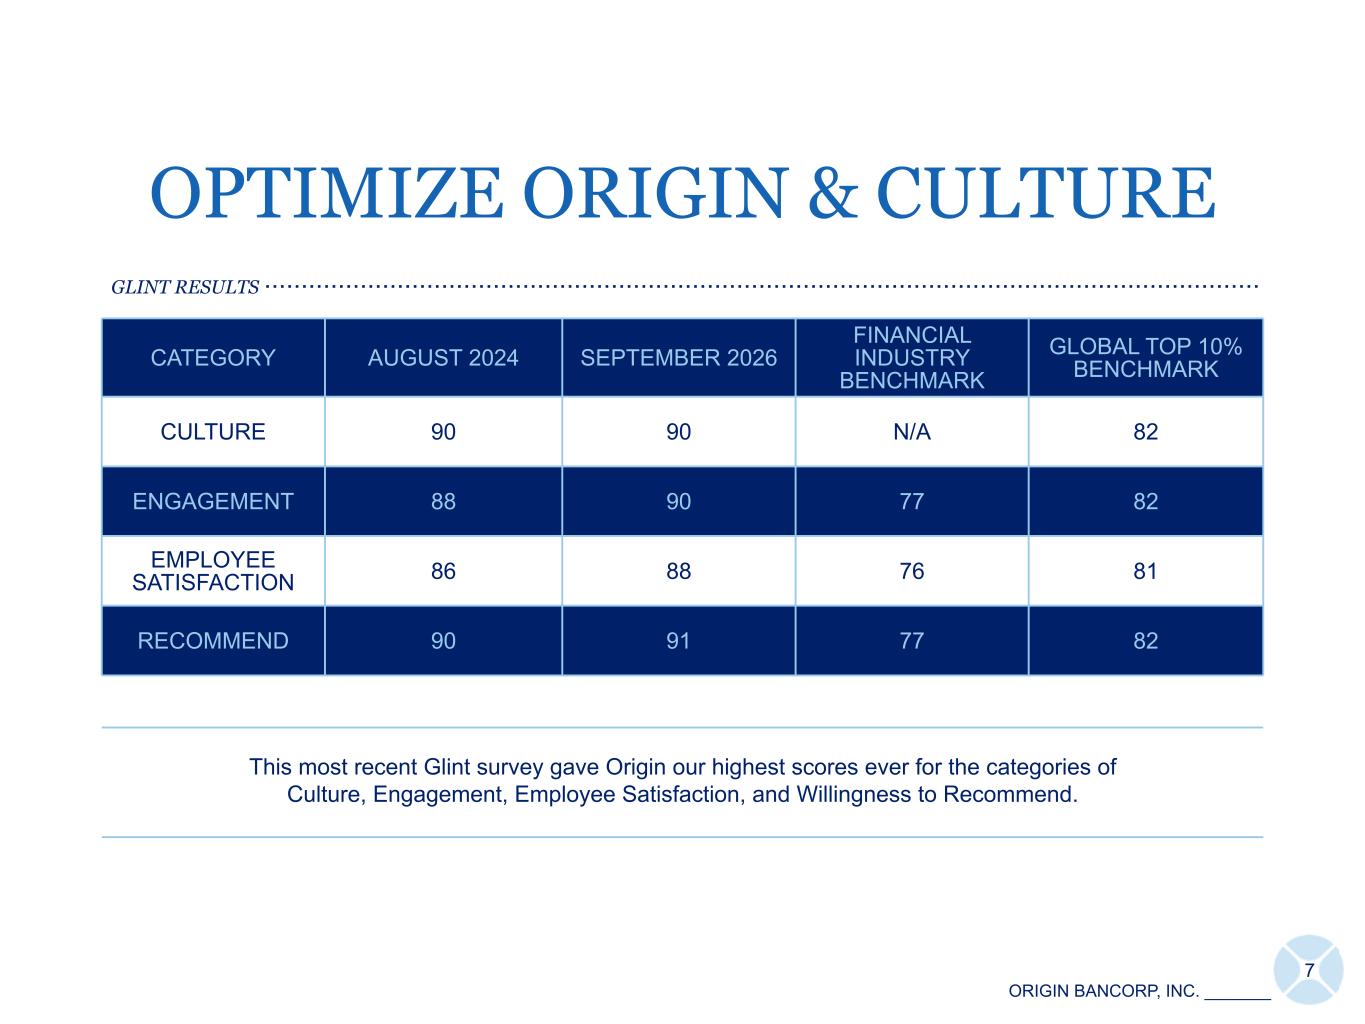
7 ORIGIN BANCORP, INC. _______ CATEGORY AUGUST 2024 SEPTEMBER 2026 FINANCIAL INDUSTRY BENCHMARK GLOBAL TOP 10% BENCHMARK CULTURE 90 90 N/A 82 ENGAGEMENT 88 90 77 82 EMPLOYEE SATISFACTION 86 88 76 81 RECOMMEND 90 91 77 82 This most recent Glint survey gave Origin our highest scores ever for the categories of Culture, Engagement, Employee Satisfaction, and Willingness to Recommend. OPTIMIZE ORIGIN & CULTURE GLINT RESULTS .......................................................................................................................................
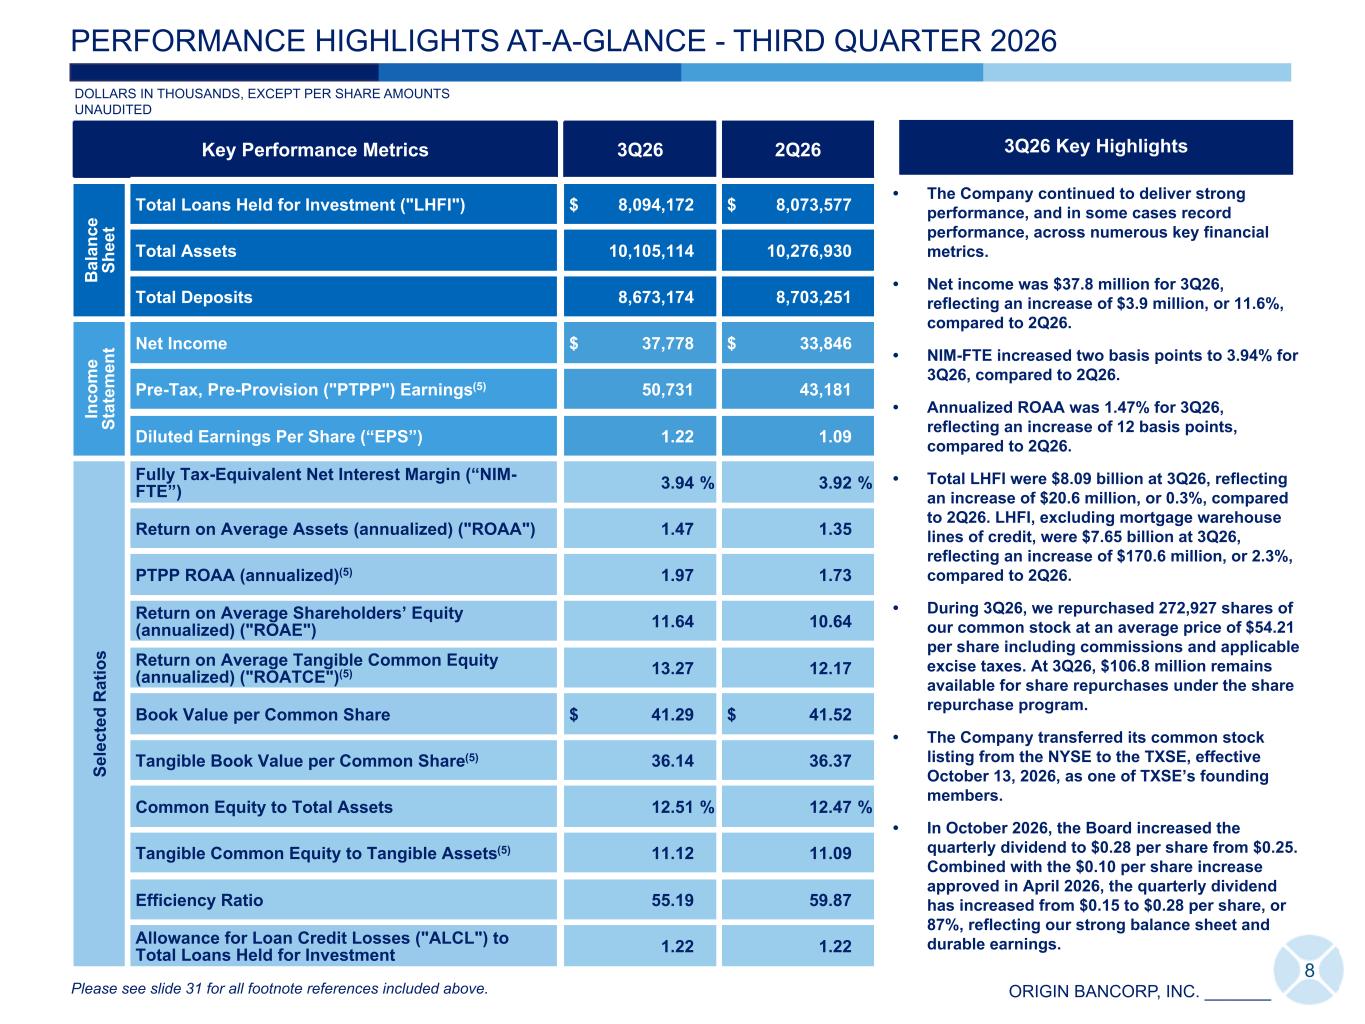
ORIGIN BANCORP, INC. _______ • The Company continued to deliver strong performance, and in some cases record performance, across numerous key financial metrics. • Net income was $37.8 million for 3Q26, reflecting an increase of $3.9 million, or 11.6%, compared to 2Q26. • NIM-FTE increased two basis points to 3.94% for 3Q26, compared to 2Q26. • Annualized ROAA was 1.47% for 3Q26, reflecting an increase of 12 basis points, compared to 2Q26. • Total LHFI were $8.09 billion at 3Q26, reflecting an increase of $20.6 million, or 0.3%, compared to 2Q26. LHFI, excluding mortgage warehouse lines of credit, were $7.65 billion at 3Q26, reflecting an increase of $170.6 million, or 2.3%, compared to 2Q26. • During 3Q26, we repurchased 272,927 shares of our common stock at an average price of $54.21 per share including commissions and applicable excise taxes. At 3Q26, $106.8 million remains available for share repurchases under the share repurchase program. • The Company transferred its common stock listing from the NYSE to the TXSE, effective October 13, 2026, as one of TXSE’s founding members. • In October 2026, the Board increased the quarterly dividend to $0.28 per share from $0.25. Combined with the $0.10 per share increase approved in April 2026, the quarterly dividend has increased from $0.15 to $0.28 per share, or 87%, reflecting our strong balance sheet and durable earnings. Key Performance Metrics 3Q26 2Q26 B al an ce Sh ee t Total Loans Held for Investment ("LHFI") $ 8,094,172 $ 8,073,577 Total Assets 10,105,114 10,276,930 Total Deposits 8,673,174 8,703,251 In co m e St at em en t Net Income $ 37,778 $ 33,846 Pre-Tax, Pre-Provision ("PTPP") Earnings(5) 50,731 43,181 Diluted Earnings Per Share (“EPS”) 1.22 1.09 Se le ct ed R at io s Fully Tax-Equivalent Net Interest Margin (“NIM- FTE”) 3.94 % 3.92 % Return on Average Assets (annualized) ("ROAA") 1.47 1.35 PTPP ROAA (annualized)(5) 1.97 1.73 Return on Average Shareholders’ Equity (annualized) ("ROAE") 11.64 10.64 Return on Average Tangible Common Equity (annualized) ("ROATCE")(5) 13.27 12.17 Book Value per Common Share $ 41.29 $ 41.52 Tangible Book Value per Common Share(5) 36.14 36.37 Common Equity to Total Assets 12.51 % 12.47 % Tangible Common Equity to Tangible Assets(5) 11.12 11.09 Efficiency Ratio 55.19 59.87 Allowance for Loan Credit Losses ("ALCL") to Total Loans Held for Investment 1.22 1.22 DOLLARS IN THOUSANDS, EXCEPT PER SHARE AMOUNTS UNAUDITED 8 PERFORMANCE HIGHLIGHTS AT-A-GLANCE - THIRD QUARTER 2026 3Q26 Key Highlights Please see slide 31 for all footnote references included above.
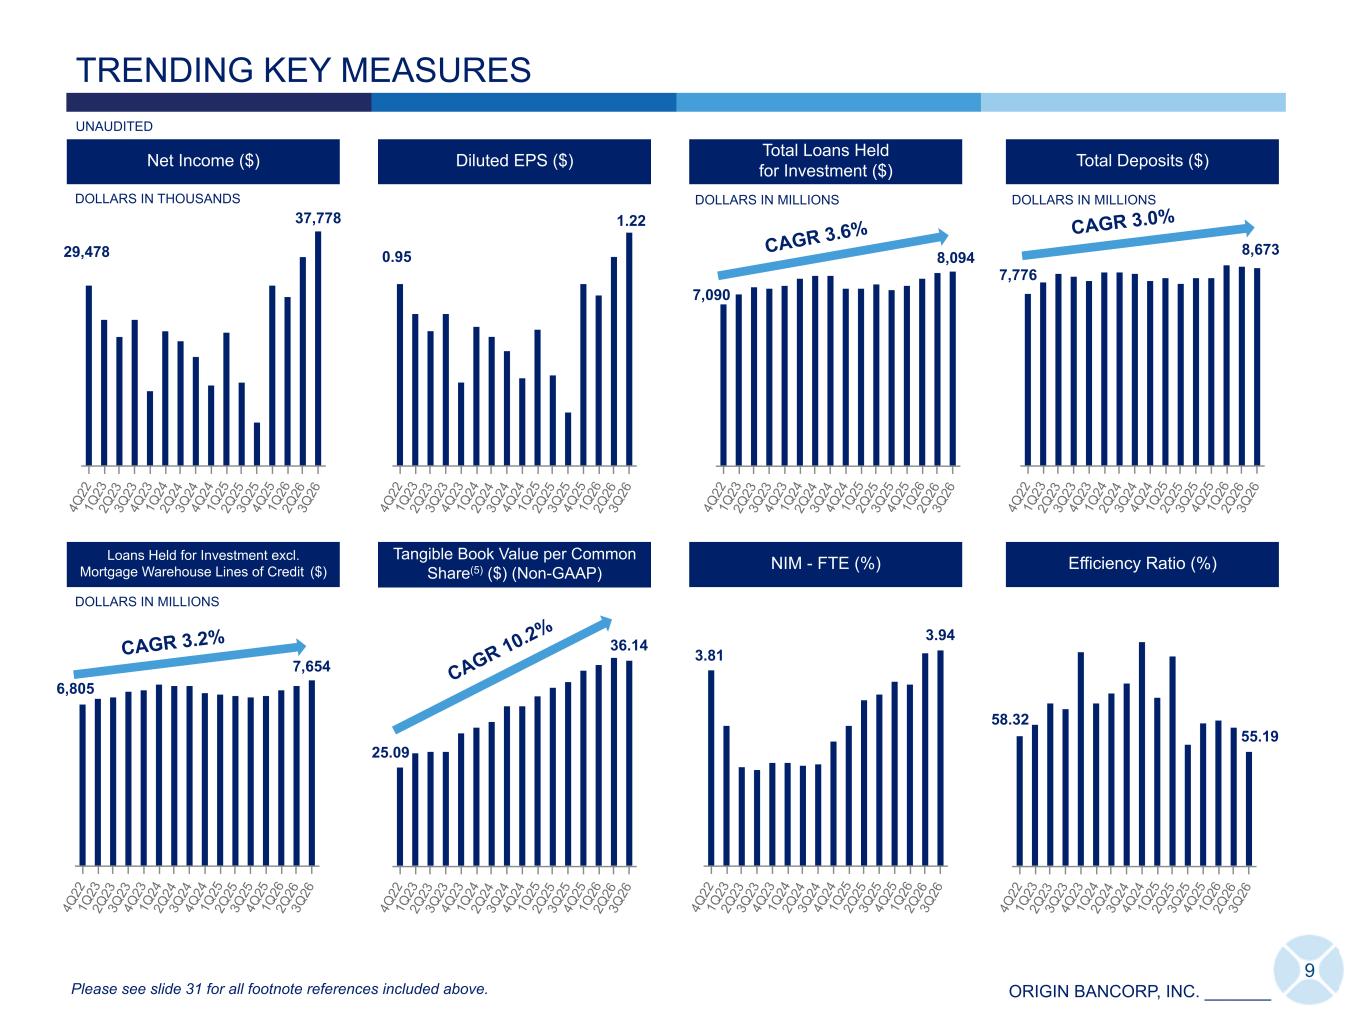
ORIGIN BANCORP, INC. _______ TRENDING KEY MEASURES UNAUDITED Diluted EPS ($)Net Income ($) Total Deposits ($) 4Q 22 1Q 23 2Q 23 3Q 23 4Q 23 1Q 24 2Q 24 3Q 24 4Q 24 1Q 25 2Q 25 3Q 25 4Q 25 1Q 26 2Q 26 3Q 26 4Q 22 1Q 23 2Q 23 3Q 23 4Q 23 1Q 24 2Q 24 3Q 24 4Q 24 1Q 25 2Q 25 3Q 25 4Q 25 1Q 26 2Q 26 3Q 26 4Q 22 1Q 23 2Q 23 3Q 23 4Q 23 1Q 24 2Q 24 3Q 24 4Q 24 1Q 25 2Q 25 3Q 25 4Q 25 1Q 26 2Q 26 3Q 26 7,654 4Q 22 1Q 23 2Q 23 3Q 23 4Q 23 1Q 24 2Q 24 3Q 24 4Q 24 1Q 25 2Q 25 3Q 25 4Q 25 1Q 26 2Q 26 3Q 26 DOLLARS IN THOUSANDS 9 Total Loans Held for Investment ($) DOLLARS IN MILLIONS 4Q 22 1Q 23 2Q 23 3Q 23 4Q 23 1Q 24 2Q 24 3Q 24 4Q 24 1Q 25 2Q 25 3Q 25 4Q 25 1Q 26 2Q 26 3Q 26 DOLLARS IN MILLIONS DOLLARS IN MILLIONS Please see slide 31 for all footnote references included above. CAGR 3.6% CAGR 3.2% CAGR 3.0% 7,776 29,478 37,778 Efficiency Ratio (%) 4Q 22 1Q 23 2Q 23 3Q 23 4Q 23 1Q 24 2Q 24 3Q 24 4Q 24 1Q 25 2Q 25 3Q 25 4Q 25 1Q 26 2Q 26 3Q 26 36.14 4Q 22 1Q 23 2Q 23 3Q 23 4Q 23 1Q 24 2Q 24 3Q 24 4Q 24 1Q 25 2Q 25 3Q 25 4Q 25 1Q 26 2Q 26 3Q 26 Tangible Book Value per Common Share(5) ($) (Non-GAAP) 4Q 22 1Q 23 2Q 23 3Q 23 4Q 23 1Q 24 2Q 24 3Q 24 4Q 24 1Q 25 2Q 25 3Q 25 4Q 25 1Q 26 2Q 26 3Q 26 Return on Average Assets (%) CAGR 10.2% 1.22 8,094 3.94 4Q 22 1Q 23 2Q 23 3Q 23 4Q 23 1Q 24 2Q 24 3Q 24 4Q 24 1Q 25 2Q 25 3Q 25 4Q 25 1Q 26 2Q 26 3Q 26 NIM - FTE (%) 3.81 1.47 1.23 6,805 7,090 8,6730.95 Loans Held for Investment excl. Mortgage Warehouse Lines of Credit ($) 25.09 58.32 55.19
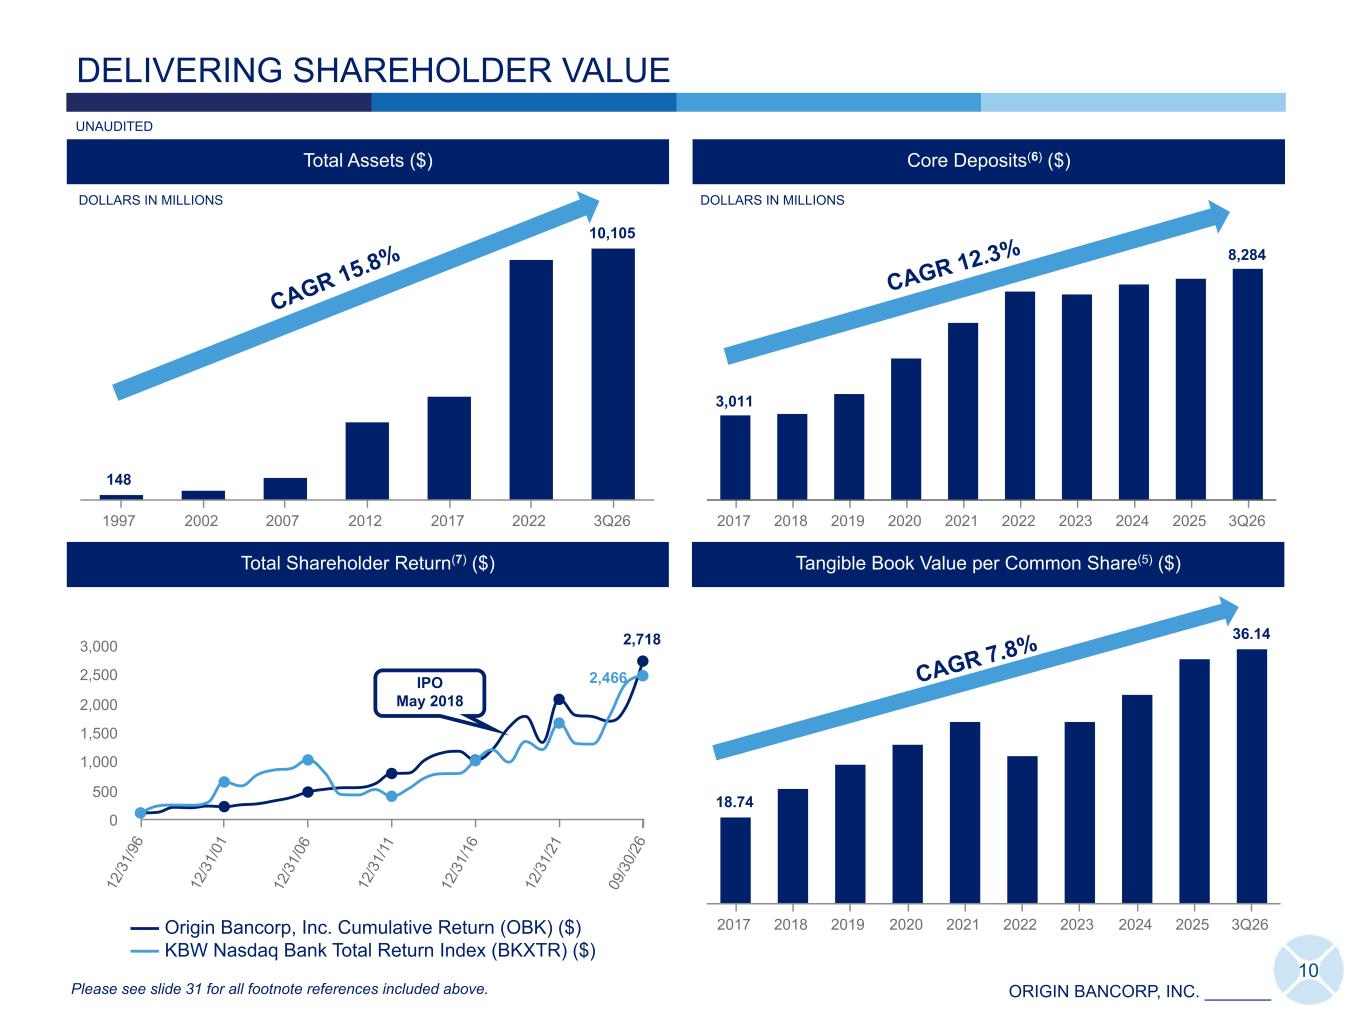
ORIGIN BANCORP, INC. _______ 148 10,105 1997 2002 2007 2012 2017 2022 3Q26 DELIVERING SHAREHOLDER VALUE DOLLARS IN MILLIONS Total Assets ($) Core Deposits(6) ($) 3,011 8,284 2017 2018 2019 2020 2021 2022 2023 2024 2025 3Q26 CAGR 15.8% CAGR 12.3% 10 2,718 2,466 Origin Bancorp, Inc. Cumulative Return (OBK) ($) KBW Nasdaq Bank Total Return Index (BKXTR) ($) 12 /3 1/ 96 12 /3 1/ 01 12 /3 1/ 06 12 /3 1/ 11 12 /3 1/ 16 12 /3 1/ 21 09 /3 0/ 26 0 500 1,000 1,500 2,000 2,500 3,000 Total Shareholder Return(7) ($) IPO May 2018 Please see slide 31 for all footnote references included above. DOLLARS IN MILLIONS UNAUDITED Tangible Book Value per Common Share(5) ($) 18.74 36.14 2017 2018 2019 2020 2021 2022 2023 2024 2025 3Q26 CAGR 7.8% 12 /3 1/ 25 148 9,725 10,105 1997 2001 2005 2009 2013 2017 2021 2025 3Q26 DOLLARS IN MILLIONS Total Assets ($) CAGR 15.8% 148 10,105 1997 2001 2005 2009 2013 2017 2021 2025 DOLLARS IN MILLIONS Total Assets ($) CAGR 15.8% 169 156 Origin Bancorp, Inc. Cumulative Return (OBK) ($) NASDAQ OMX ABA Community Bank Total Rtn (ABQX) $ 05 /0 8/ 18 12 /3 1/ 18 12 /3 1/ 19 12 /3 1/ 20 12 /3 1/ 21 12 /3 1/ 22 12 /3 1/ 23 12 /3 1/ 24 12 /3 1/ 25 06 /3 0/ 26 100 150 Total Shareholder Return(7) ($) IPO 169 216 Origin Bancorp, Inc. Cumulative Return (OBK) ($) KBW Nasdaq Bank Total Return Index (BKXTR) ($) 05 /0 8/ 18 12 /3 1/ 18 12 /3 1/ 19 12 /3 1/ 20 12 /3 1/ 21 12 /3 1/ 22 12 /3 1/ 23 12 /3 1/ 24 12 /3 1/ 25 06 /3 0/ 26 100 200 IPO Total Shareholder Return(7) ($)
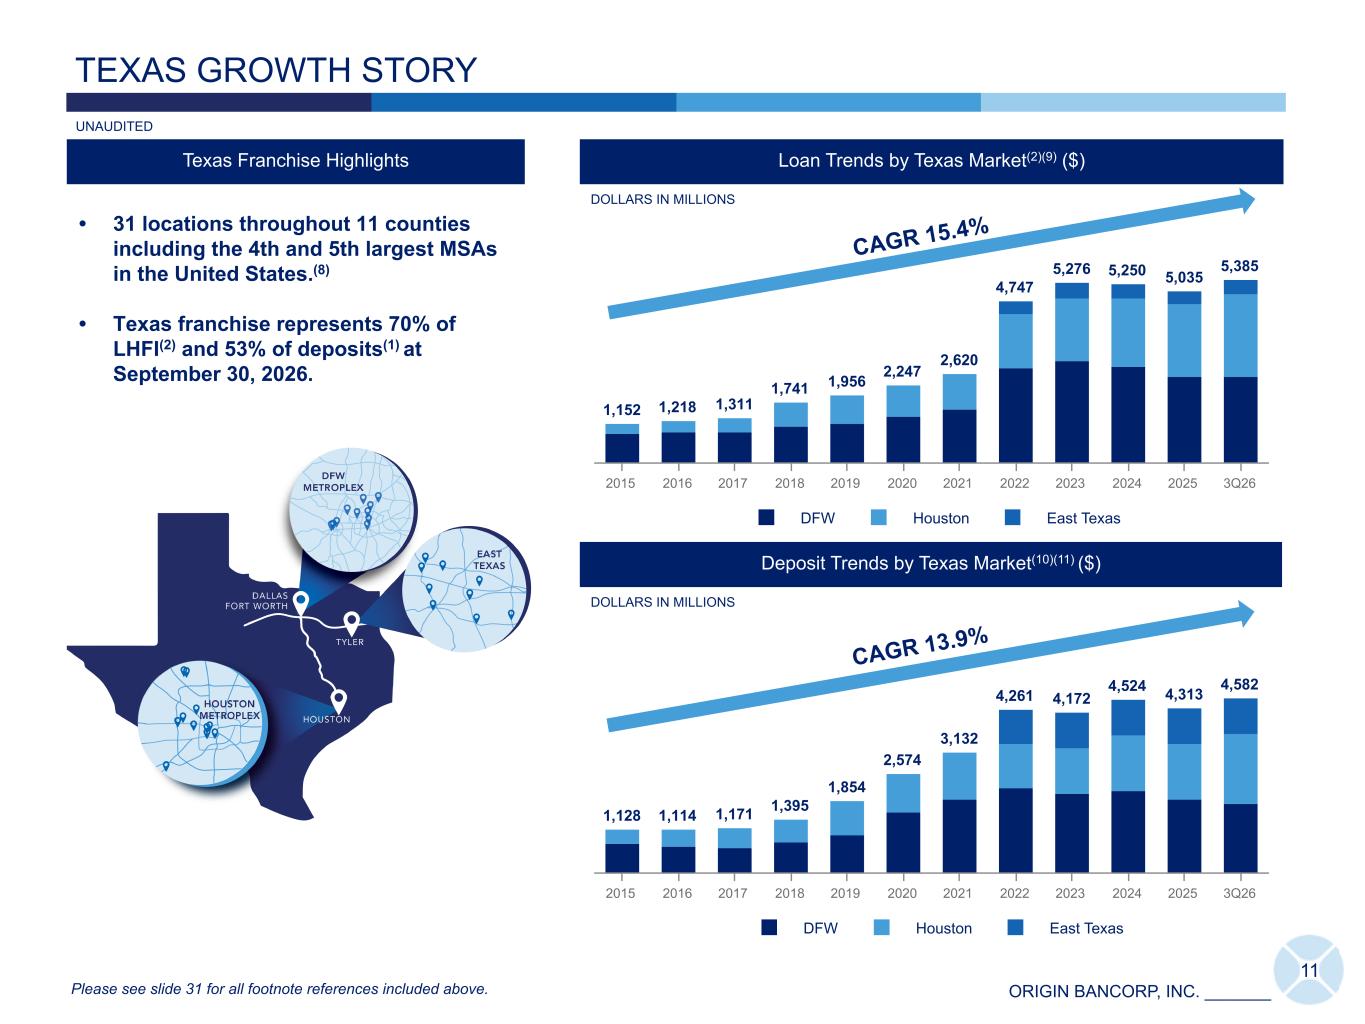
ORIGIN BANCORP, INC. _______ 11 1,152 1,218 1,311 1,741 1,956 2,247 2,620 4,747 5,276 5,250 5,035 5,385 DFW Houston East Texas 2015 2016 2017 2018 2019 2020 2021 2022 2023 2024 2025 3Q26 Deposit Trends by Texas Market(10)(11) ($) Loan Trends by Texas Market(2)(9) ($) TEXAS GROWTH STORY Texas Franchise Highlights DOLLARS IN MILLIONS • 31 locations throughout 11 counties including the 4th and 5th largest MSAs in the United States.(8) • Texas franchise represents 70% of LHFI(2) and 53% of deposits(1) at September 30, 2026. 1,128 1,114 1,171 1,395 1,854 2,574 3,132 4,261 4,172 4,524 4,313 4,582 DFW Houston East Texas 2015 2016 2017 2018 2019 2020 2021 2022 2023 2024 2025 3Q26 Please see slide 31 for all footnote references included above. DOLLARS IN MILLIONS UNAUDITED CAGR 13.9% CAGR 15.4%
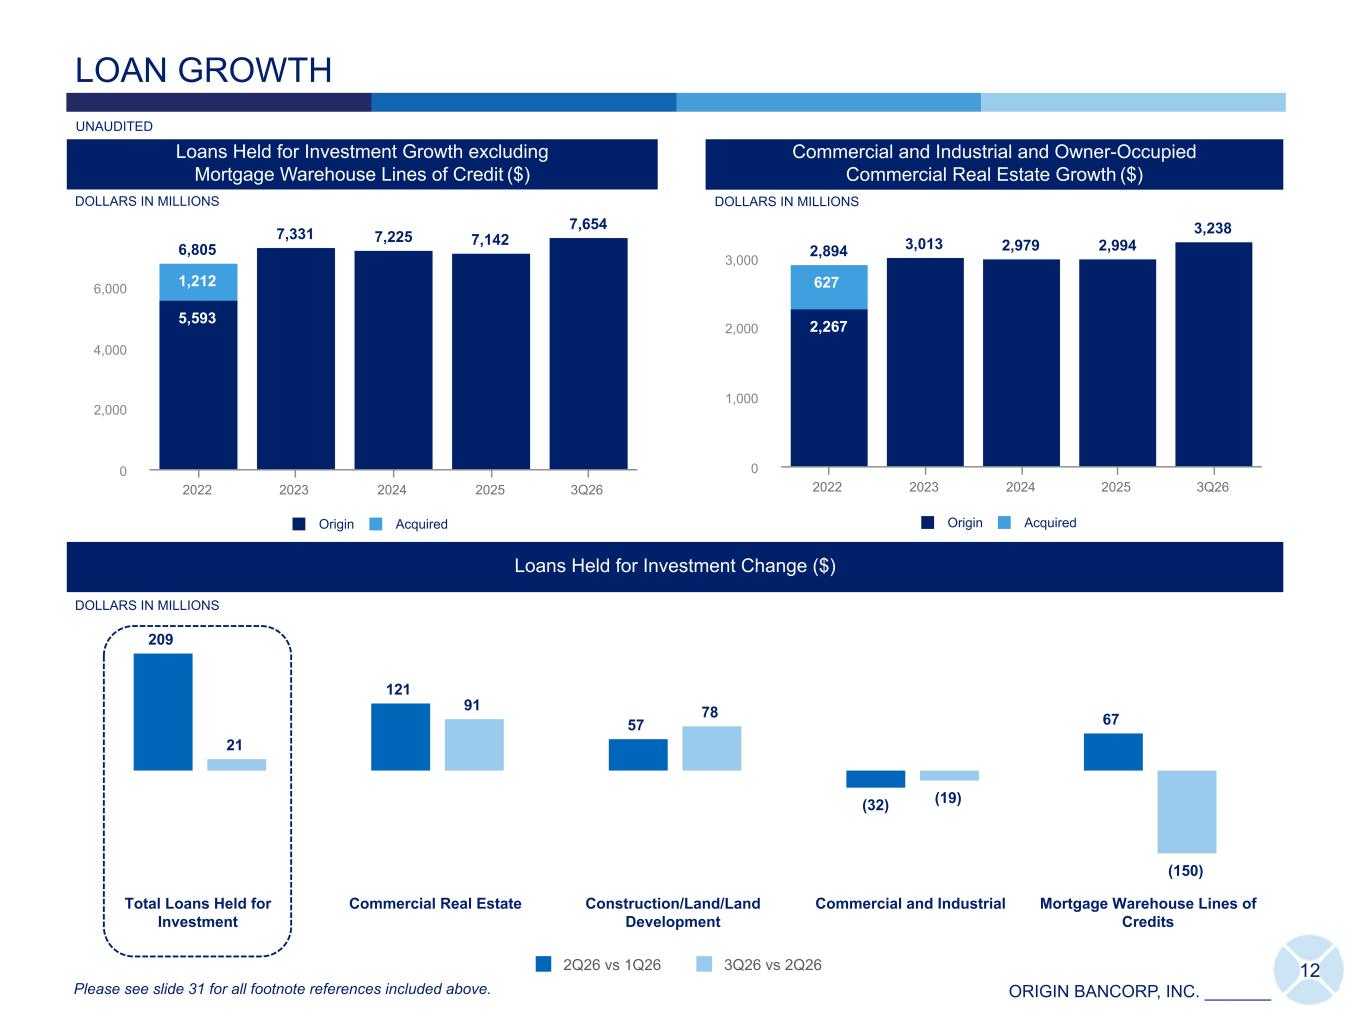
ORIGIN BANCORP, INC. _______ 209 121 57 (32) 67 21 91 78 (19) (150) 2Q26 vs 1Q26 3Q26 vs 2Q26 Total Loans Held for Investment Commercial Real Estate Construction/Land/Land Development Commercial and Industrial Mortgage Warehouse Lines of Credits LOAN GROWTH 6,805 7,331 7,225 7,142 7,654 5,593 7,142 7,654 1,212 Origin Acquired 2022 2023 2024 2025 3Q26 0 2,000 4,000 6,000 DOLLARS IN MILLIONS IDT Loans Held for Investment Growth excluding Mortgage Warehouse Lines of Credit ($) 2,894 3,013 2,979 2,994 3,238 2,267 2,994 3,238 627 Origin Acquired 2022 2023 2024 2025 3Q26 0 1,000 2,000 3,000 Loans Held for Investment Change ($) Please see slide 31 for all footnote references included above. DOLLARS IN MILLIONS UNAUDITED Commercial and Industrial and Owner-Occupied Commercial Real Estate Growth ($) 12 DOLLARS IN MILLIONS
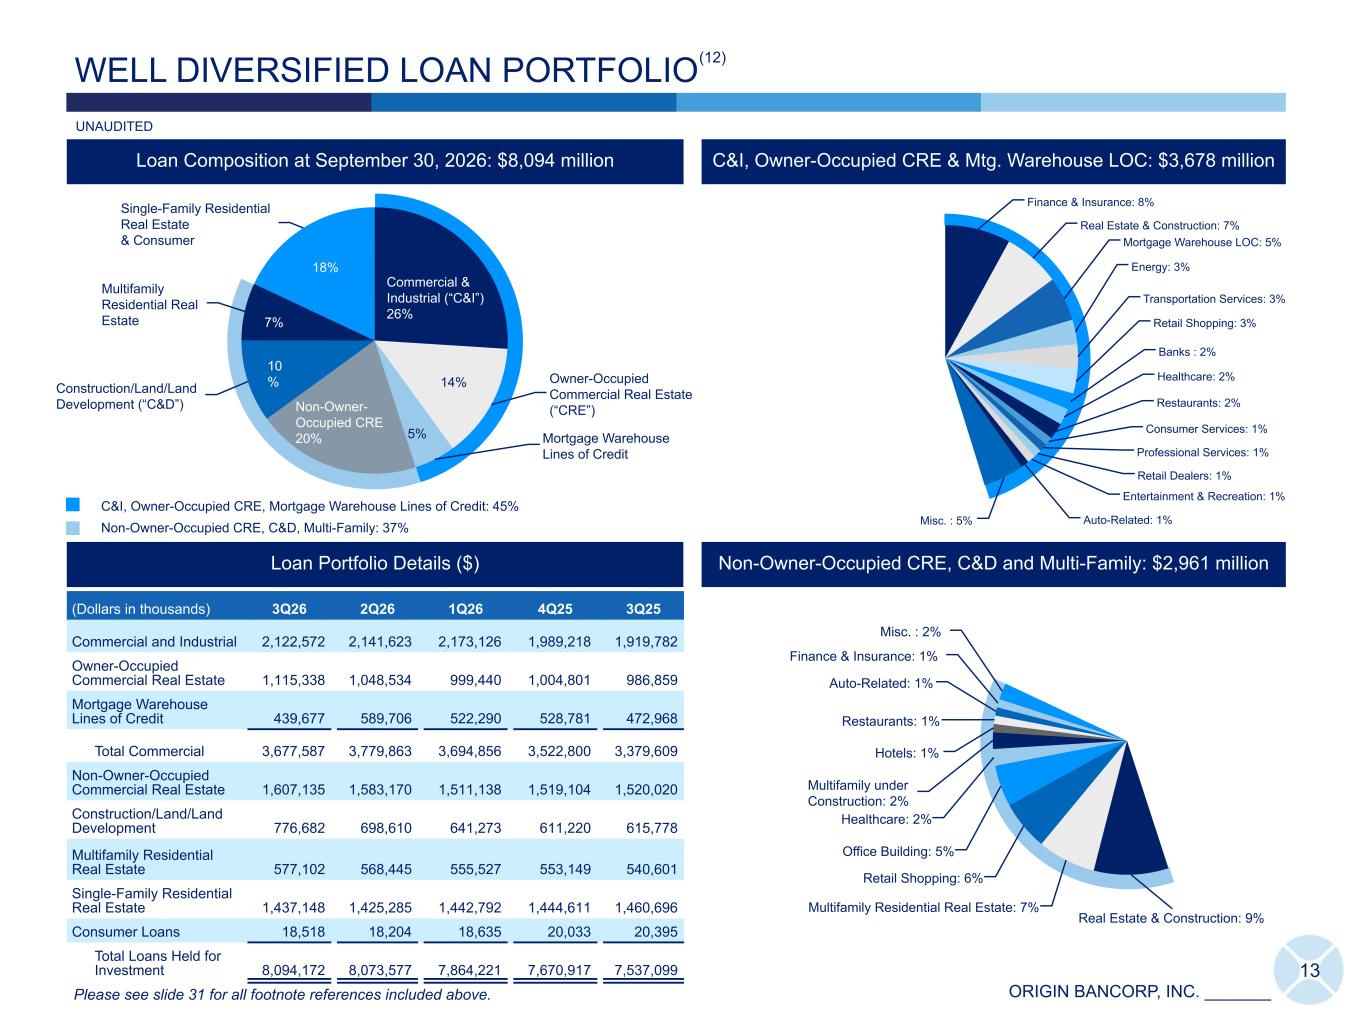
ORIGIN BANCORP, INC. _______ Commercial & Industrial (“C&I”) 26% Owner-Occupied Commercial Real Estate (“CRE”) Mortgage Warehouse Lines of Credit Non-Owner- Occupied CRE 20% Construction/Land/Land Development (“C&D”) Multifamily Residential Real Estate Single-Family Residential Real Estate & Consumer Real Estate & Construction: 9% Multifamily Residential Real Estate: 7% Retail Shopping: 6% Office Building: 5% Healthcare: 2% Multifamily under Construction: 2% Hotels: 1% Restaurants: 1% Auto-Related: 1% Finance & Insurance: 1% Misc. : 2% Finance & Insurance: 8% Real Estate & Construction: 7% Mortgage Warehouse LOC: 5% Energy: 3% Transportation Services: 3% Retail Shopping: 3% Banks : 2% Healthcare: 2% Restaurants: 2% Consumer Services: 1% Professional Services: 1% Retail Dealers: 1% Entertainment & Recreation: 1% Auto-Related: 1%Misc. : 5% 13 WELL DIVERSIFIED LOAN PORTFOLIO (Dollars in thousands) 3Q26 2Q26 1Q26 4Q25 3Q25 Commercial and Industrial 2,122,572 2,141,623 2,173,126 1,989,218 1,919,782 Owner-Occupied Commercial Real Estate 1,115,338 1,048,534 999,440 1,004,801 986,859 Mortgage Warehouse Lines of Credit 439,677 589,706 522,290 528,781 472,968 Total Commercial 3,677,587 3,779,863 3,694,856 3,522,800 3,379,609 Non-Owner-Occupied Commercial Real Estate 1,607,135 1,583,170 1,511,138 1,519,104 1,520,020 Construction/Land/Land Development 776,682 698,610 641,273 611,220 615,778 Multifamily Residential Real Estate 577,102 568,445 555,527 553,149 540,601 Single-Family Residential Real Estate 1,437,148 1,425,285 1,442,792 1,444,611 1,460,696 Consumer Loans 18,518 18,204 18,635 20,033 20,395 Total Loans Held for Investment 8,094,172 8,073,577 7,864,221 7,670,917 7,537,099 Loan Portfolio Details ($) C&I, Owner-Occupied CRE & Mtg. Warehouse LOC: $3,678 million C&I, Owner-Occupied CRE, Mortgage Warehouse Lines of Credit: 45% Non-Owner-Occupied CRE, C&D, Multi-Family: 37% Loan Composition at September 30, 2026: $8,094 million Please see slide 31 for all footnote references included above. UNAUDITED (12) Non-Owner-Occupied CRE, C&D and Multi-Family: $2,961 million 14% 5% 18% 7% 10 %
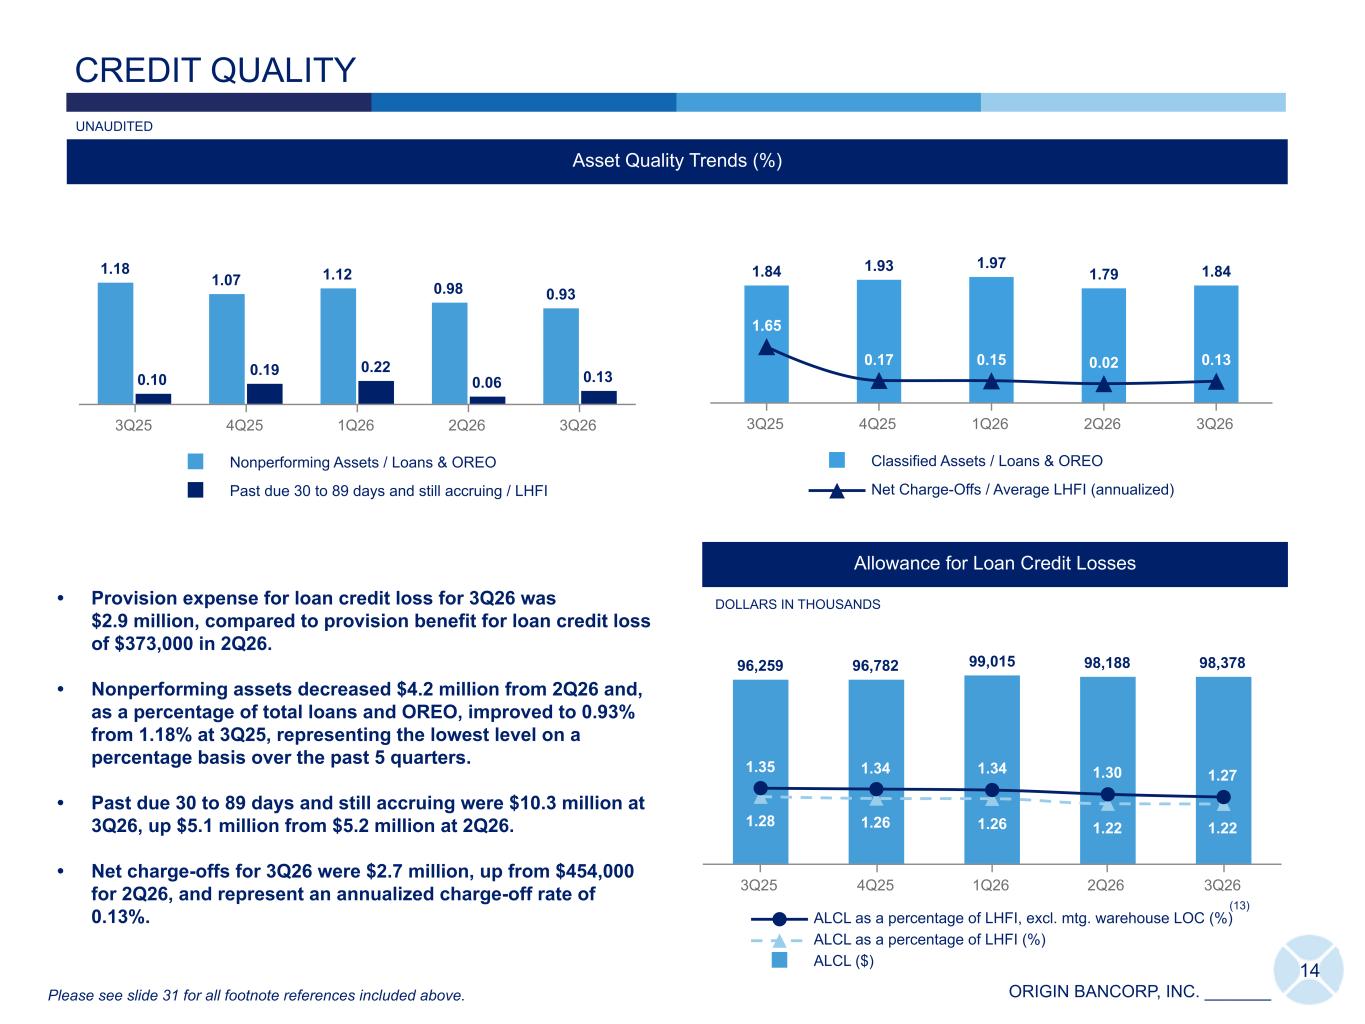
ORIGIN BANCORP, INC. _______ 1.84 1.93 1.97 1.79 1.84 1.65 0.17 0.15 0.02 0.13 Classified Assets / Loans & OREO Net Charge-Offs / Average LHFI (annualized) 3Q25 4Q25 1Q26 2Q26 3Q26 1.18 1.07 1.12 0.98 0.93 0.10 0.19 0.22 0.06 0.13 Nonperforming Assets / Loans & OREO Past due 30 to 89 days and still accruing / LHFI 3Q25 4Q25 1Q26 2Q26 3Q26 14 CREDIT QUALITY Asset Quality Trends (%) Allowance for Loan Credit Losses 96,259 96,782 99,015 98,188 98,378 1.28 1.26 1.26 1.22 1.22 1.35 1.34 1.34 1.30 1.27 ALCL as a percentage of LHFI, excl. mtg. warehouse LOC (%) ALCL as a percentage of LHFI (%) ALCL ($) 3Q25 4Q25 1Q26 2Q26 3Q26 DOLLARS IN THOUSANDS (13) Please see slide 31 for all footnote references included above. UNAUDITED 18,981 (123) (3,858) (8,605) 2Q26 Downgrades OREO net transactions Charge-offs Payments 3Q26 88,859 81,878 88,273 79,281 75,102 Total NPA ($) 3Q25 4Q25 1Q26 2Q26 3Q26 Nonperforming Asset Trends ($) • Provision expense for loan credit loss for 3Q26 was $2.9 million, compared to provision benefit for loan credit loss of $373,000 in 2Q26. • Nonperforming assets decreased $4.2 million from 2Q26 and, as a percentage of total loans and OREO, improved to 0.93% from 1.18% at 3Q25, representing the lowest level on a percentage basis over the past 5 quarters. • Past due 30 to 89 days and still accruing were $10.3 million at 3Q26, up $5.1 million from $5.2 million at 2Q26. • Net charge-offs for 3Q26 were $2.7 million, up from $454,000 for 2Q26, and represent an annualized charge-off rate of 0.13%.
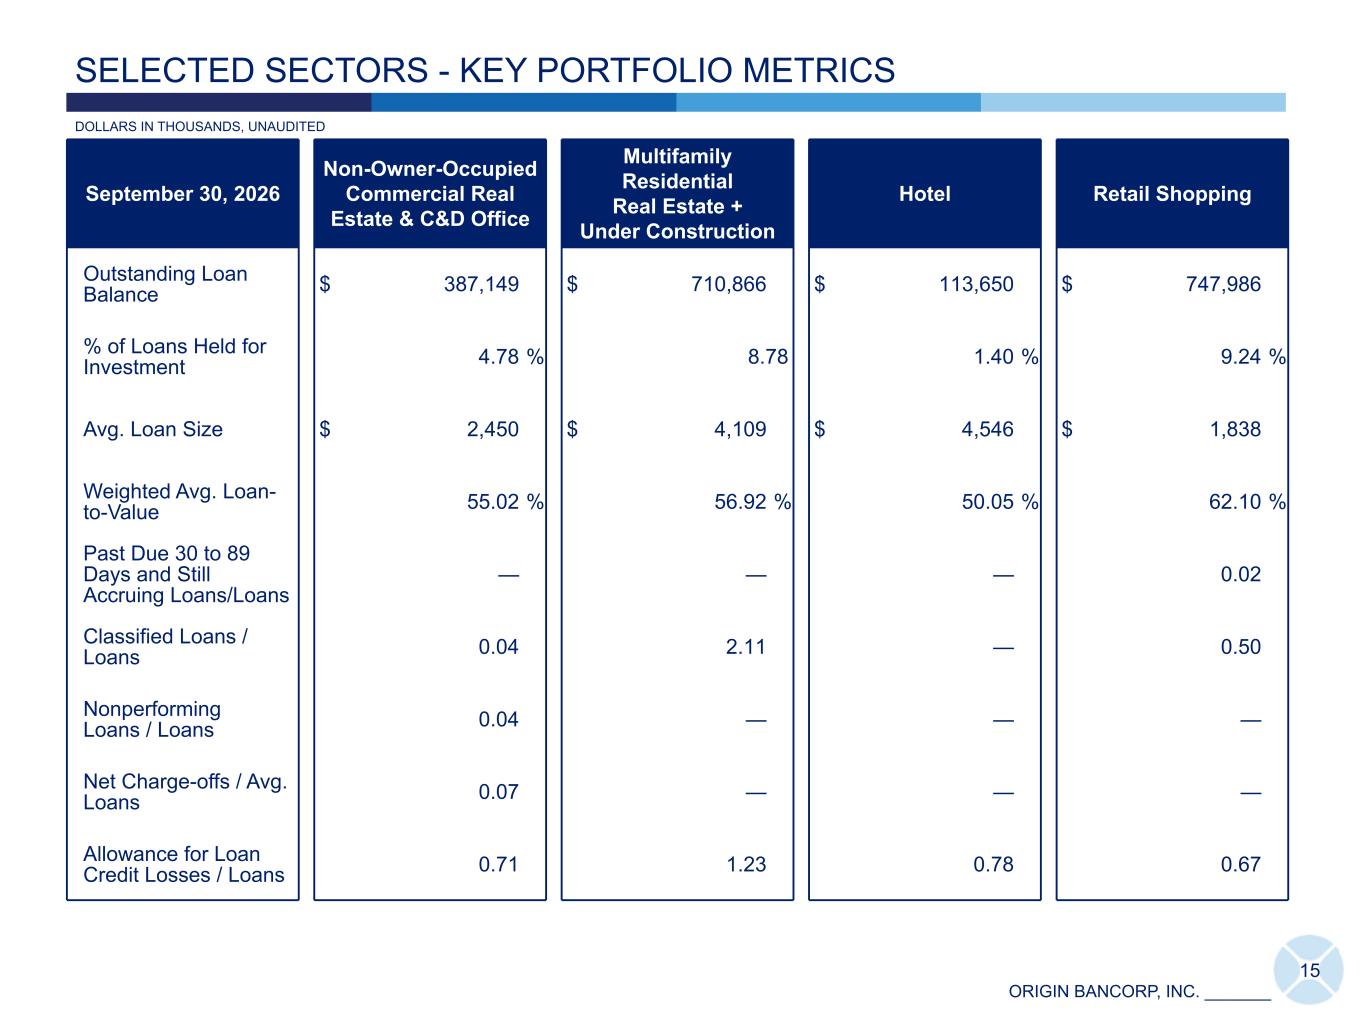
ORIGIN BANCORP, INC. _______ 15 SELECTED SECTORS - KEY PORTFOLIO METRICS September 30, 2026 Non-Owner-Occupied Commercial Real Estate & C&D Office Multifamily Residential Real Estate + Under Construction Hotel Retail Shopping Outstanding Loan Balance $ 387,149 $ 710,866 $ 113,650 $ 747,986 % of Loans Held for Investment 4.78 % 8.78 1.40 % 9.24 % Avg. Loan Size $ 2,450 $ 4,109 $ 4,546 $ 1,838 Weighted Avg. Loan- to-Value 55.02 % 56.92 % 50.05 % 62.10 % Past Due 30 to 89 Days and Still Accruing Loans/Loans — — — 0.02 Classified Loans / Loans 0.04 2.11 — 0.50 Nonperforming Loans / Loans 0.04 — — — Net Charge-offs / Avg. Loans 0.07 — — — Allowance for Loan Credit Losses / Loans 0.71 1.23 0.78 0.67 DOLLARS IN THOUSANDS, UNAUDITED
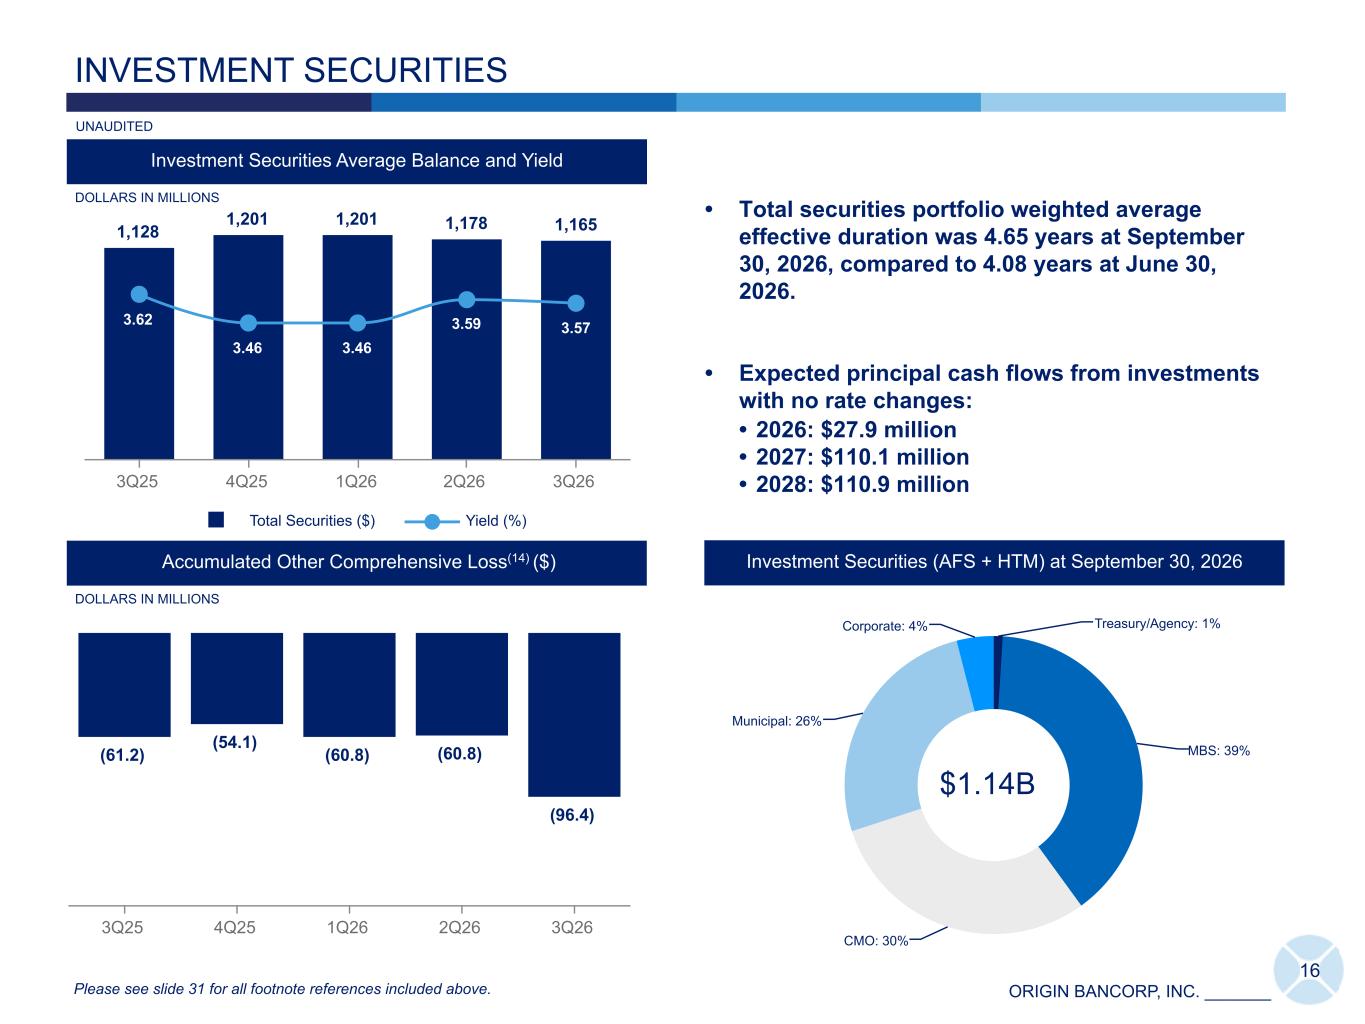
ORIGIN BANCORP, INC. _______ Treasury/Agency: 1% MBS: 39% CMO: 30% Municipal: 26% Corporate: 4% 1,128 1,201 1,201 1,178 1,165 3.62 3.46 3.46 3.59 3.57 Total Securities ($) Yield (%) 3Q25 4Q25 1Q26 2Q26 3Q26 Investment Securities Average Balance and Yield INVESTMENT SECURITIES DOLLARS IN MILLIONS • Total securities portfolio weighted average effective duration was 4.65 years at September 30, 2026, compared to 4.08 years at June 30, 2026. • Expected principal cash flows from investments with no rate changes: • 2026: $27.9 million • 2027: $110.1 million • 2028: $110.9 million 16 (61.2) (54.1) (60.8) (60.8) (96.4) 3Q25 4Q25 1Q26 2Q26 3Q26 Accumulated Other Comprehensive Loss(14) ($) Investment Securities (AFS + HTM) at September 30, 2026 Please see slide 31 for all footnote references included above. $1.14B DOLLARS IN MILLIONS UNAUDITED
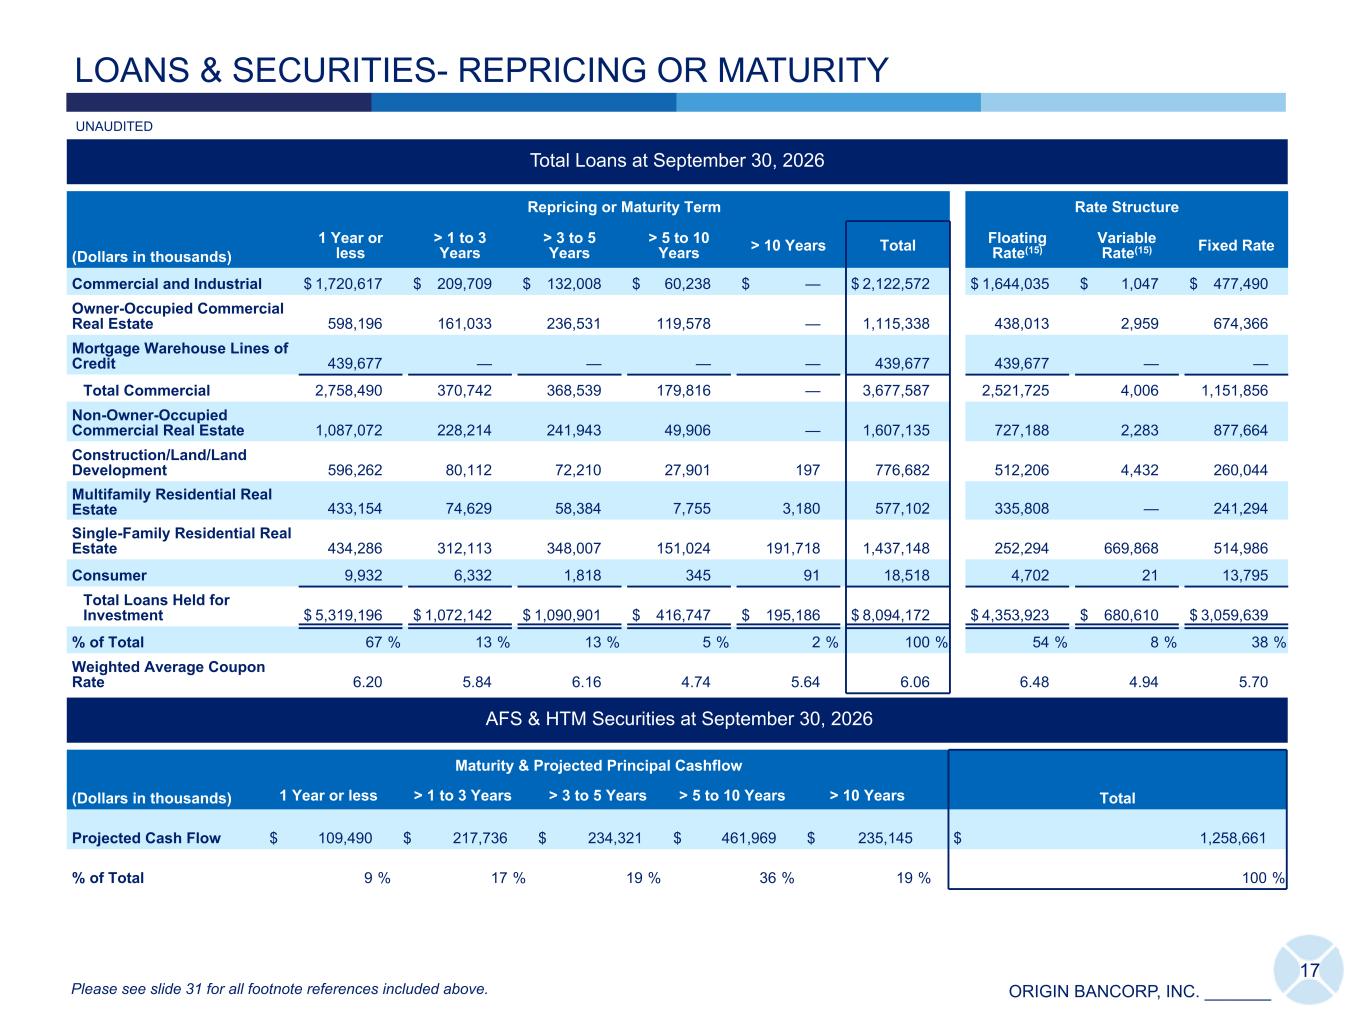
ORIGIN BANCORP, INC. _______ Total Loans at September 30, 2026 (Dollars in thousands) Repricing or Maturity Term Rate Structure 1 Year or less > 1 to 3 Years > 3 to 5 Years > 5 to 10 Years > 10 Years Total Floating Rate(15) Variable Rate(15) Fixed Rate Commercial and Industrial $ 1,720,617 $ 209,709 $ 132,008 $ 60,238 $ — $ 2,122,572 $ 1,644,035 $ 1,047 $ 477,490 Owner-Occupied Commercial Real Estate 598,196 161,033 236,531 119,578 — 1,115,338 438,013 2,959 674,366 Mortgage Warehouse Lines of Credit 439,677 — — — — 439,677 439,677 — — Total Commercial 2,758,490 370,742 368,539 179,816 — 3,677,587 2,521,725 4,006 1,151,856 Non-Owner-Occupied Commercial Real Estate 1,087,072 228,214 241,943 49,906 — 1,607,135 727,188 2,283 877,664 Construction/Land/Land Development 596,262 80,112 72,210 27,901 197 776,682 512,206 4,432 260,044 Multifamily Residential Real Estate 433,154 74,629 58,384 7,755 3,180 577,102 335,808 — 241,294 Single-Family Residential Real Estate 434,286 312,113 348,007 151,024 191,718 1,437,148 252,294 669,868 514,986 Consumer 9,932 6,332 1,818 345 91 18,518 4,702 21 13,795 Total Loans Held for Investment $ 5,319,196 $ 1,072,142 $ 1,090,901 $ 416,747 $ 195,186 $ 8,094,172 $ 4,353,923 $ 680,610 $ 3,059,639 % of Total 67 % 13 % 13 % 5 % 2 % 100 % 54 % 8 % 38 % Weighted Average Coupon Rate 6.20 5.84 6.16 4.74 5.64 6.06 6.48 4.94 5.70 AFS & HTM Securities at September 30, 2026 (Dollars in thousands) Maturity & Projected Principal Cashflow Total1 Year or less > 1 to 3 Years > 3 to 5 Years > 5 to 10 Years > 10 Years Projected Cash Flow $ 109,490 $ 217,736 $ 234,321 $ 461,969 $ 235,145 $ 1,258,661 % of Total 9 % 17 % 19 % 36 % 19 % 100 % LOANS & SECURITIES- REPRICING OR MATURITY 17 UNAUDITED Please see slide 31 for all footnote references included above.
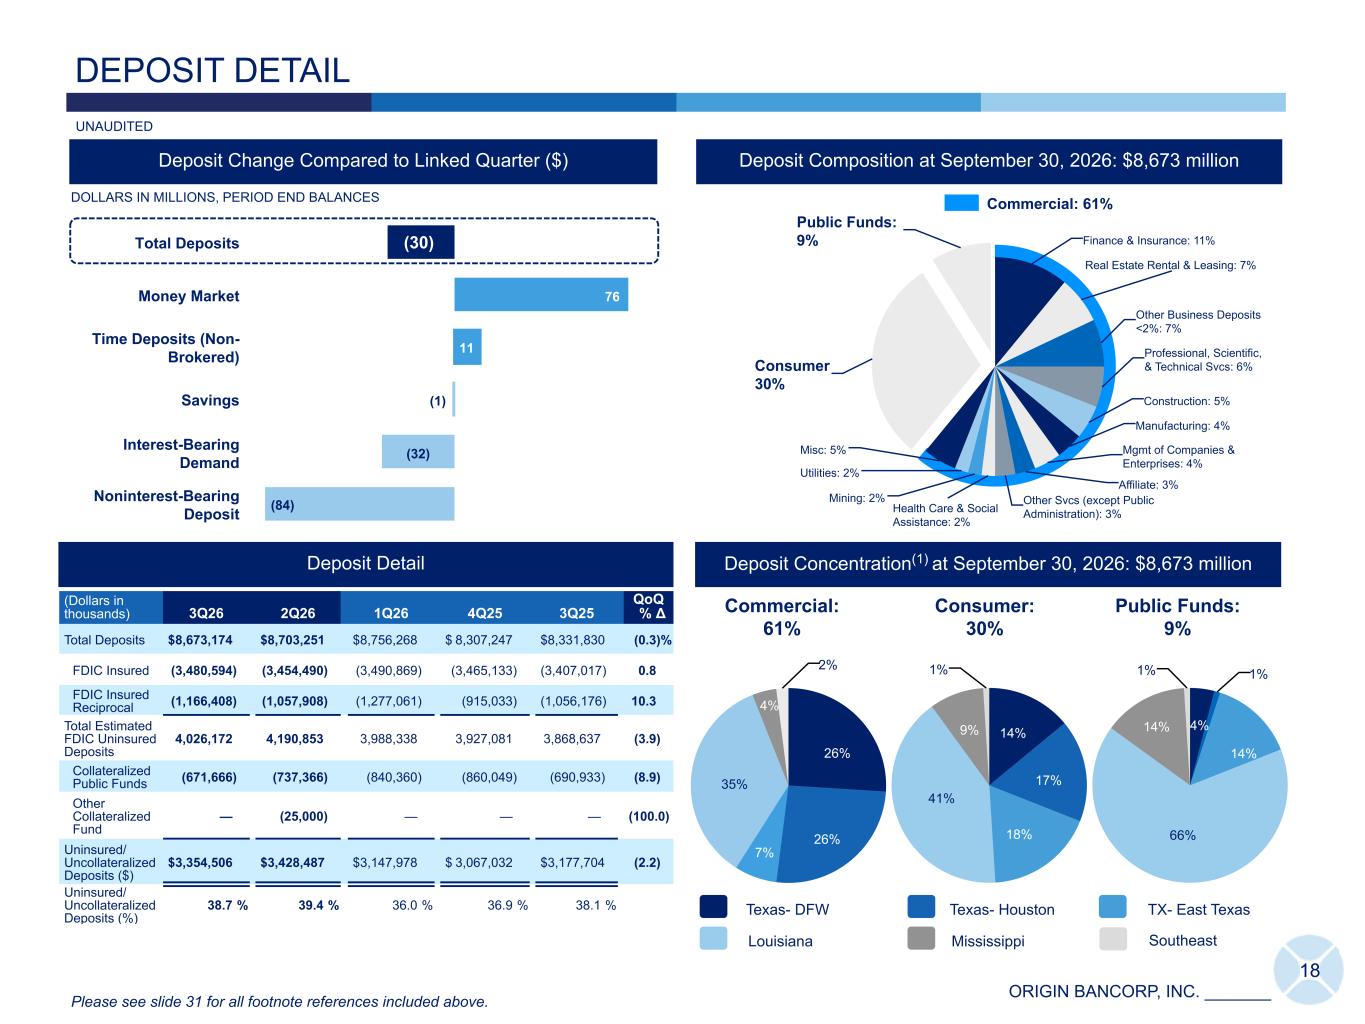
ORIGIN BANCORP, INC. _______ Finance & Insurance: 11% Real Estate Rental & Leasing: 7% Other Business Deposits <2%: 7% Professional, Scientific, & Technical Svcs: 6% Construction: 5% Manufacturing: 4% Mgmt of Companies & Enterprises: 4% Affiliate: 3% Other Svcs (except Public Administration): 3%Health Care & Social Assistance: 2% Mining: 2% Utilities: 2% Misc: 5% Consumer 30% Public Funds: 9% 26% 26% 7% 35% 4% 2% 18 DEPOSIT DETAIL (Dollars in thousands) 3Q26 2Q26 1Q26 4Q25 3Q25 QoQ % Δ Total Deposits $ 8,673,174 $ 8,486,568 $ 8,510,842 $ 8,505,464 $ 8,251,125 2.2 % FDIC Insured (3,464,116) (3,464,116) (3,442,636) (3,447,538) (3,425,268) — FDIC Insured Reciprocal (1,093,952) (1,093,952) (799,221) (801,145) (801,699) — FDIC Insured Brokered Deposits (431,609) (431,609) (636,814) (597,110) (444,989) — Total Estimated FDIC Uninsured Deposits 3,683,497 3,496,891 3,632,171 3,659,671 3,579,169 5.3 Collateralized Public Funds (714,431) (714,431) (771,419) (836,150) (849,603) — Uninsured/ Uncollateralized Deposits ($) $ 2,969,066 $ 2,782,460 $ 2,860,752 $ 2,823,521 $ 2,729,566 6.7 Uninsured/ Uncollateralized Deposits (%) 34.2 % 32.8 % 33.6 % 33.2 % 33.1 % Deposit Detail Deposit Concentration(1) at September 30, 2026: $8,673 million Deposit Composition at September 30, 2026: $8,673 million MississippiLouisiana Texas- DFW TX- East TexasTexas- Houston Please see slide 31 for all footnote references included above. UNAUDITED Southeast 14% 17% 18% 41% 9% 1% (Dollars in thousands) 3Q26 2Q26 1Q26 4Q25 3Q25 QoQ % Δ Total Deposits $ 8,673,174 $ 8,703,251 $ 8,756,268 $ 8,307,247 $ 8,331,830 (0.3) % FDIC Insured (3,480,594) (3,454,490) (3,490,869) (3,465,133) (3,407,017) 0.8 FDIC Insured Reciprocal (1,166,408) (1,057,908) (1,277,061) (915,033) (1,056,176) 10.3 Total Estimated FDIC Uninsured Deposits 4,026,172 4,190,853 3,988,338 3,927,081 3,868,637 (3.9) Collateralized Public Funds (671,666) (737,366) (840,360) (860,049) (690,933) (8.9) Other Collateralized Fund — (25,000) — — — (100.0) Uninsured/ Uncollateralized Deposits ($) $ 3,354,506 $ 3,428,487 $ 3,147,978 $ 3,067,032 $ 3,177,704 (2.2) Uninsured/ Uncollateralized Deposits (%) 38.7 % 39.4 % 36.0 % 36.9 % 38.1 % Deposit Detail 4% 1% 14% 66% 14% 1% (30) 76 11 (1) (32) (84) Total Deposits Money Market Time Deposits (Non- Brokered) Savings Interest-Bearing Demand Noninterest-Bearing Deposit Deposit Change Compared to Linked Quarter ($) DOLLARS IN MILLIONS, PERIOD END BALANCES Customer Deposits +(1)MM Commercial: 61% Commercial: 61% Consumer: 30% Public Funds: 9% 76 11 (1) (30) (32) (84) Money Market Time Deposits (Non- Brokered) Savings Total Deposits Interest- Bearing Demand Noninterest- Bearing Deposit Deposit Change Compared to Linked Quarter ($) DOLLARS IN MILLIONS, PERIOD END BALANCES
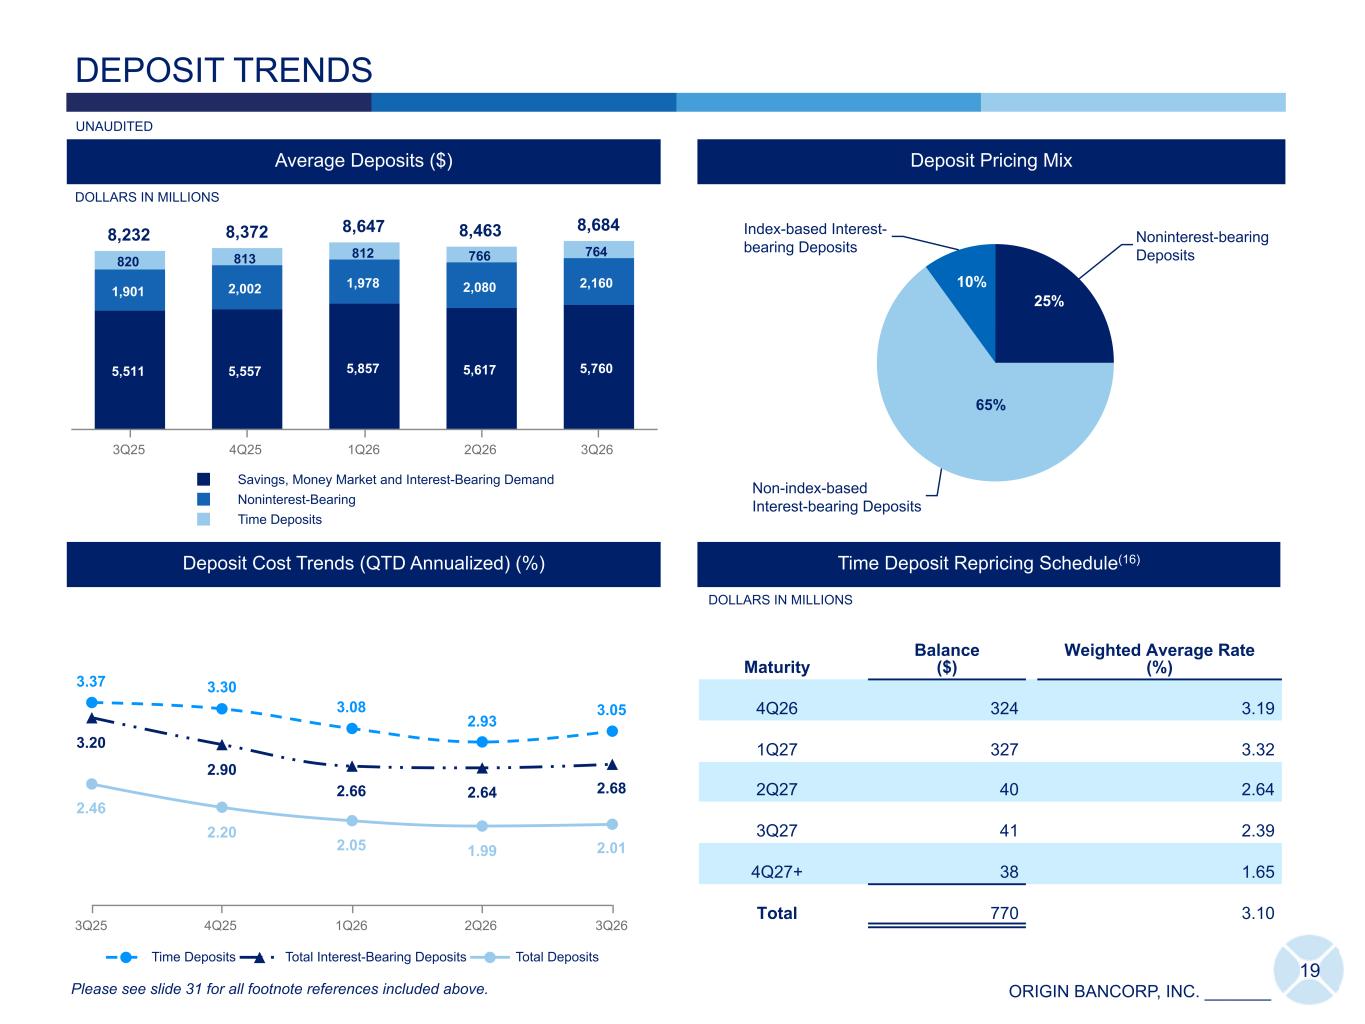
ORIGIN BANCORP, INC. _______ 3.37 3.30 3.08 2.93 3.05 3.20 2.90 2.66 2.64 2.68 2.46 2.20 2.05 1.99 2.01 Time Deposits Total Interest-Bearing Deposits Total Deposits 3Q25 4Q25 1Q26 2Q26 3Q26 19 8,232 8,372 8,647 8,463 8,684 5,511 5,557 5,857 5,617 5,760 1,901 2,002 1,978 2,080 2,160 820 813 812 766 764 Savings, Money Market and Interest-Bearing Demand Noninterest-Bearing Time Deposits 3Q25 4Q25 1Q26 2Q26 3Q26 Average Deposits ($) DEPOSIT TRENDS IDT DOLLARS IN MILLIONS UNAUDITED Deposit Cost Trends (QTD Annualized) (%) Time Deposit Repricing Schedule(16) Maturity Balance ($) Weighted Average Rate (%) 4Q26 324 3.19 1Q27 327 3.32 2Q27 40 2.64 3Q27 41 2.39 4Q27+ 38 1.65 Total 770 3.10 DOLLARS IN MILLIONS 57.14 57.35 66.00 71.00 69.90 68.53 66.86 70.00 68.82 5.26 4.65 4.33 4.33 4.30 3.90 3.64 3.63 3.63 3.14 2.79 2.52 2.47 2.46 2.20 2.05 1.99 2.01 Cumulative Deposit Beta Average Quarterly Fed Funds Rate Cost of Total Deposit 3Q24 4Q24 1Q25 2Q25 3Q25 4Q25 1Q26 2Q26 3Q26 Please see slide 31 for all footnote references included above. Deposit Pricing Mix Customer Deposits +(1)MM (16) Noninterest-bearing Deposits Non-index-based Interest-bearing Deposits Index-based Interest- bearing Deposits 10% 25% 65%
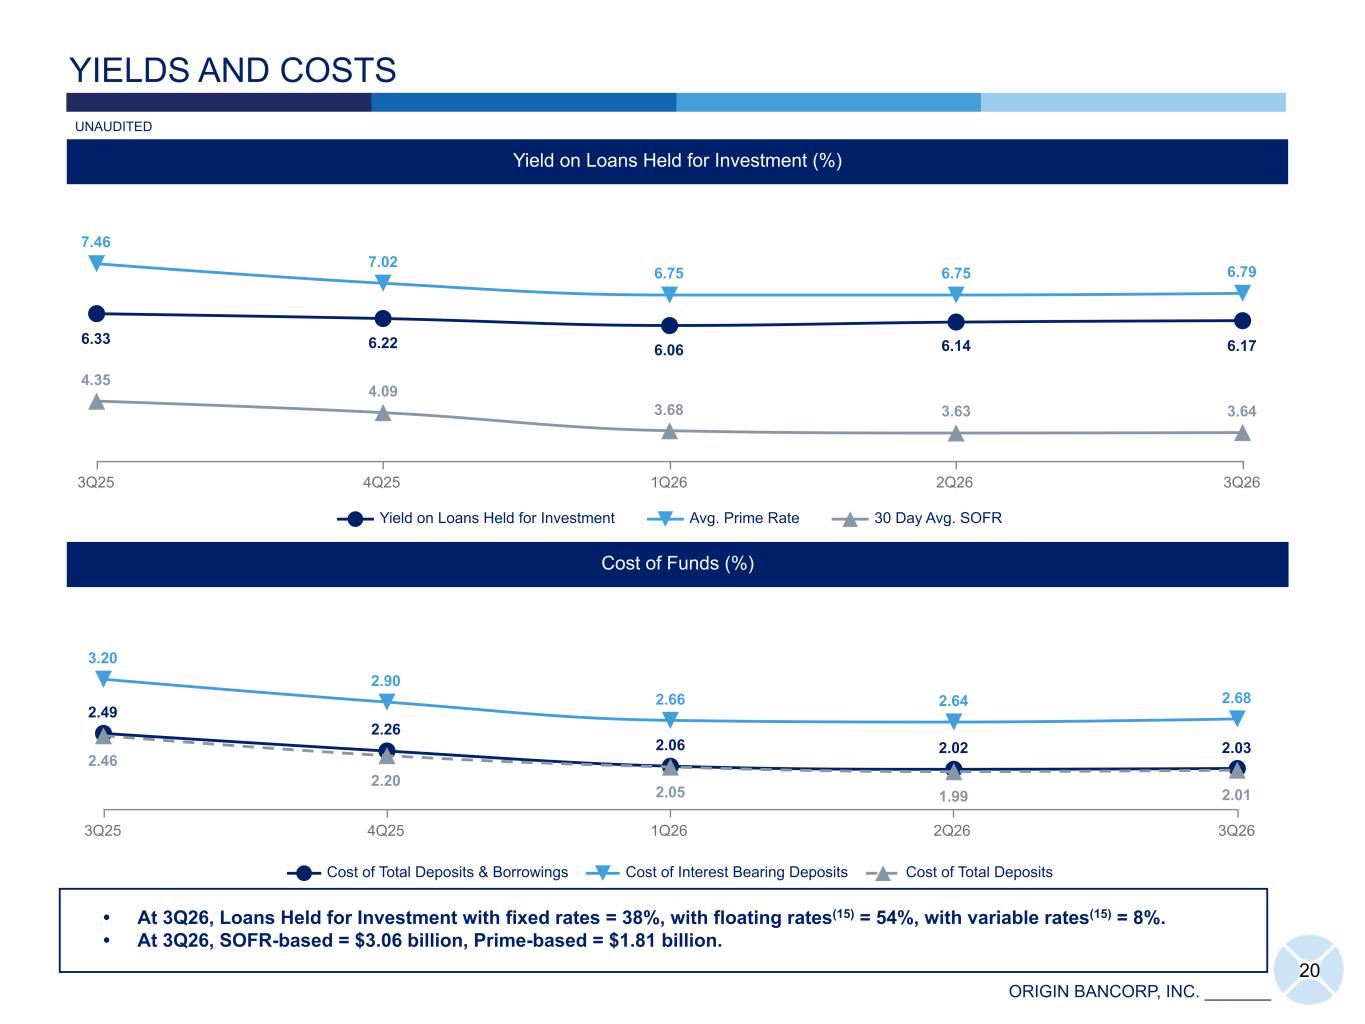
ORIGIN BANCORP, INC. _______ 2.49 2.26 2.06 2.02 2.03 3.20 2.90 2.66 2.64 2.68 2.46 2.20 2.05 1.99 2.01 Cost of Total Deposits & Borrowings Cost of Interest Bearing Deposits Cost of Total Deposits 3Q25 4Q25 1Q26 2Q26 3Q26 20 YIELDS AND COSTS Yield on Loans Held for Investment (%) Cost of Funds (%) • At 3Q26, Loans Held for Investment with fixed rates = 38%, with floating rates(15) = 54%, with variable rates(15) = 8%. • At 3Q26, SOFR-based = $3.06 billion, Prime-based = $1.81 billion. UNAUDITED 6.33 6.22 6.06 6.14 6.17 7.46 7.02 6.75 6.75 6.79 4.35 4.09 3.68 3.63 3.64 Yield on Loans Held for Investment Avg. Prime Rate 30 Day Avg. SOFR 3Q25 4Q25 1Q26 2Q26 3Q26
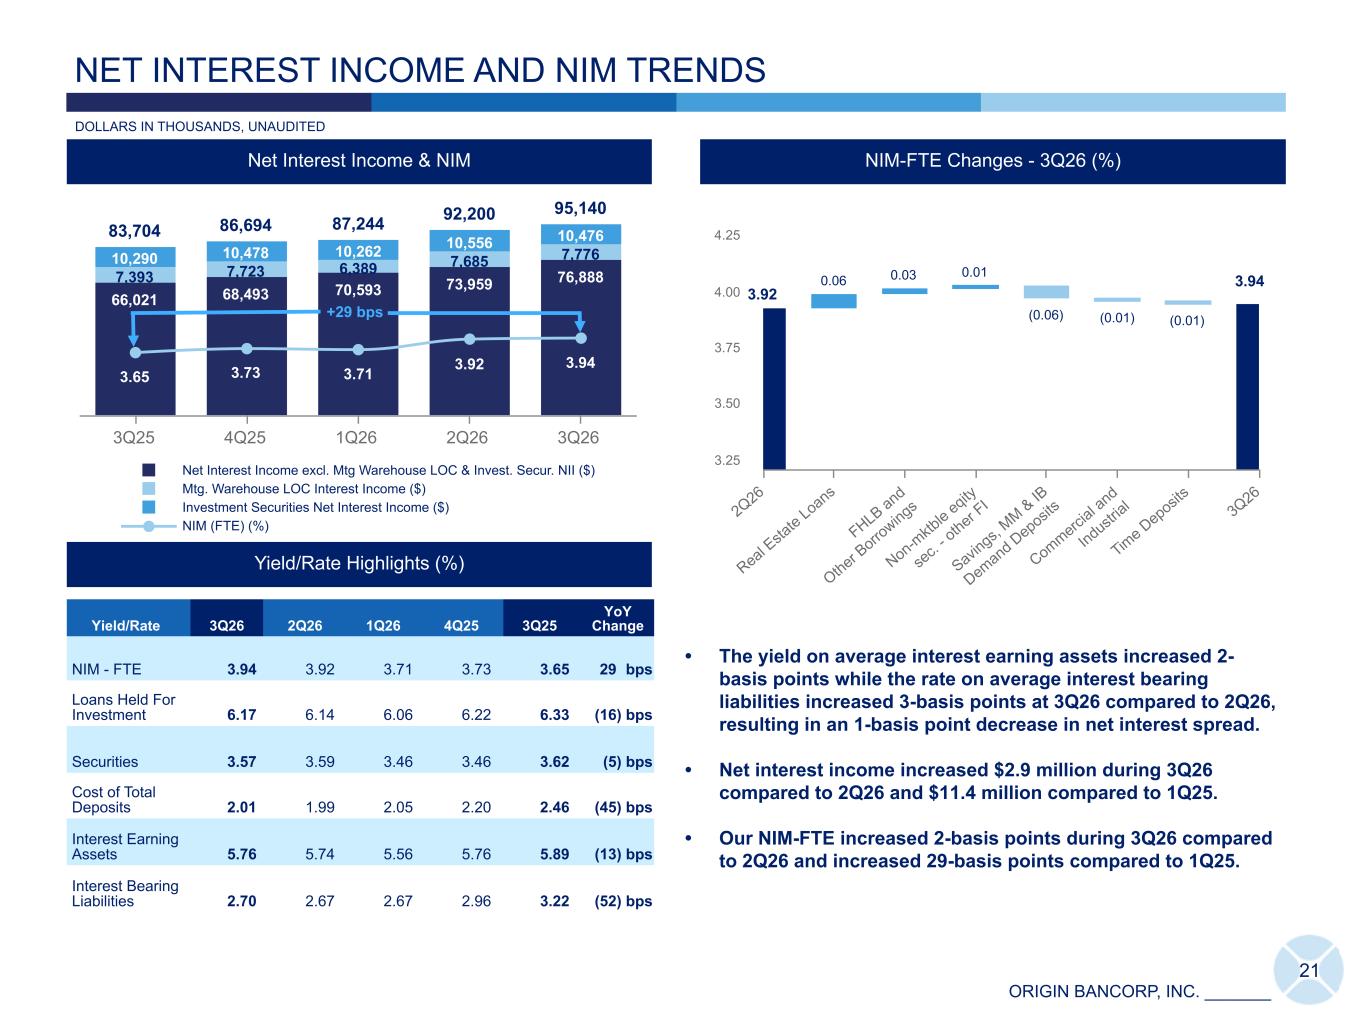
ORIGIN BANCORP, INC. _______ 83,704 86,694 87,244 92,200 95,140 66,021 68,493 70,593 73,959 76,8887,393 7,723 6,389 7,685 7,77610,290 10,478 10,262 10,556 10,476 3.65 3.73 3.71 3.92 3.94 Net Interest Income excl. Mtg Warehouse LOC & Invest. Secur. NII ($) Mtg. Warehouse LOC Interest Income ($) Investment Securities Net Interest Income ($) NIM (FTE) (%) 3Q25 4Q25 1Q26 2Q26 3Q26 21 DOLLARS IN THOUSANDS, UNAUDITED NET INTEREST INCOME AND NIM TRENDS 3.92 0.06 0.03 0.01 (0.06) (0.01) (0.01) 2Q26 Real E sta te Loans FHLB and Other B orro wings Non-m ktb le eqity se c. - o ther F I Savin gs, MM & IB Demand Deposits Commerci al a nd Industr ial Tim e Deposits 3Q26 3.25 3.50 3.75 4.00 4.25 24.64 29.52 21.01 8.58 2.041.54 2.480.77 2.18 3.65 4.51 5.26 5.33 4.65 3.90 Cumulative NIM-FTE Beta Average Quarterly Fed Funds Rate 4Q23 1Q24 2Q24 3Q24 1Q25 2Q25 3Q25 4Q25 3Q26 NIM Beta - 3Q26 (%) 2.48 2.48 4.99 NIM-FTE Changes - 3Q26 (%) NIM-FTE Changes - 3Q26 (%) 73,32372,989 1,362 1,537 568 432 (298) (3,267) 4Q 23 RE Lo an s C&I MW LO C Othe r FH LB & O the r Bor ro wing s Sav ing s & IB Tr an sa c. Acc ts. 1Q 24 40,000 60,000 80,000 • The yield on average interest earning assets increased 2- basis points while the rate on average interest bearing liabilities increased 3-basis points at 3Q26 compared to 2Q26, resulting in an 1-basis point decrease in net interest spread. • Net interest income increased $2.9 million during 3Q26 compared to 2Q26 and $11.4 million compared to 1Q25. • Our NIM-FTE increased 2-basis points during 3Q26 compared to 2Q26 and increased 29-basis points compared to 1Q25. Net Interest Income & NIM 3.94 Yield/Rate 3Q26 2Q26 1Q26 4Q25 3Q25 YoY Change NIM - FTE 3.94 3.92 3.71 3.73 3.65 29 bps Loans Held For Investment 6.17 6.14 6.06 6.22 6.33 (16) bps Securities 3.57 3.59 3.46 3.46 3.62 (5) bps Cost of Total Deposits 2.01 1.99 2.05 2.20 2.46 (45) bps Interest Earning Assets 5.76 5.74 5.56 5.76 5.89 (13) bps Interest Bearing Liabilities 2.70 2.67 2.67 2.96 3.22 (52) bps Yield/Rate Highlights (%) +29 bps
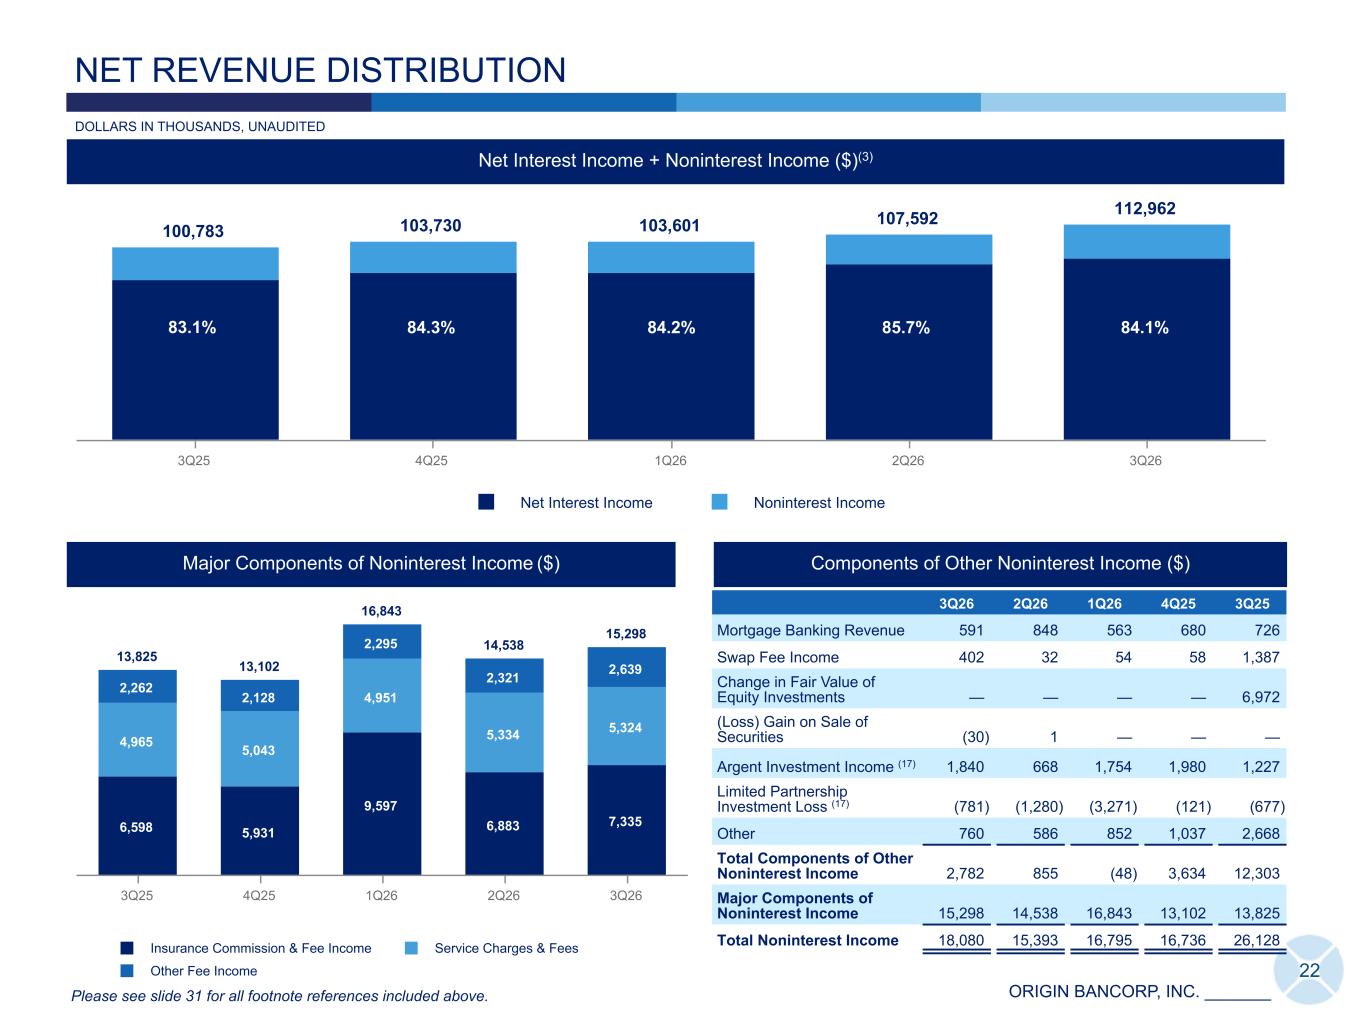
ORIGIN BANCORP, INC. _______ 100,783 103,730 103,601 107,592 112,962 Net Interest Income Noninterest Income 3Q25 4Q25 1Q26 2Q26 3Q26 13,825 13,102 16,843 14,538 15,298 6,598 5,931 9,597 6,883 7,335 4,965 5,043 4,951 5,334 5,324 2,262 2,128 2,295 2,321 2,639 Insurance Commission & Fee Income Service Charges & Fees Other Fee Income 3Q25 4Q25 1Q26 2Q26 3Q26 22 Major Components of Noninterest Income ($) Net Interest Income + Noninterest Income ($)(3) NET REVENUE DISTRIBUTION Components of Other Noninterest Income ($) 3Q26 2Q26 1Q26 4Q25 3Q25 Mortgage Banking Revenue 591 848 563 680 726 Swap Fee Income 402 32 54 58 1,387 Change in Fair Value of Equity Investments — — — — 6,972 (Loss) Gain on Sale of Securities (30) 1 — — — Argent Investment Income (17) 1,840 668 1,754 1,980 1,227 Limited Partnership Investment Loss (17) (781) (1,280) (3,271) (121) (677) Other 760 586 852 1,037 2,668 Total Components of Other Noninterest Income 2,782 855 (48) 3,634 12,303 Major Components of Noninterest Income 15,298 14,538 16,843 13,102 13,825 Total Noninterest Income 18,080 15,393 16,795 16,736 26,128 83.1% 84.1% Please see slide 31 for all footnote references included above. DOLLARS IN THOUSANDS, UNAUDITED 85.7%84.2%84.3%
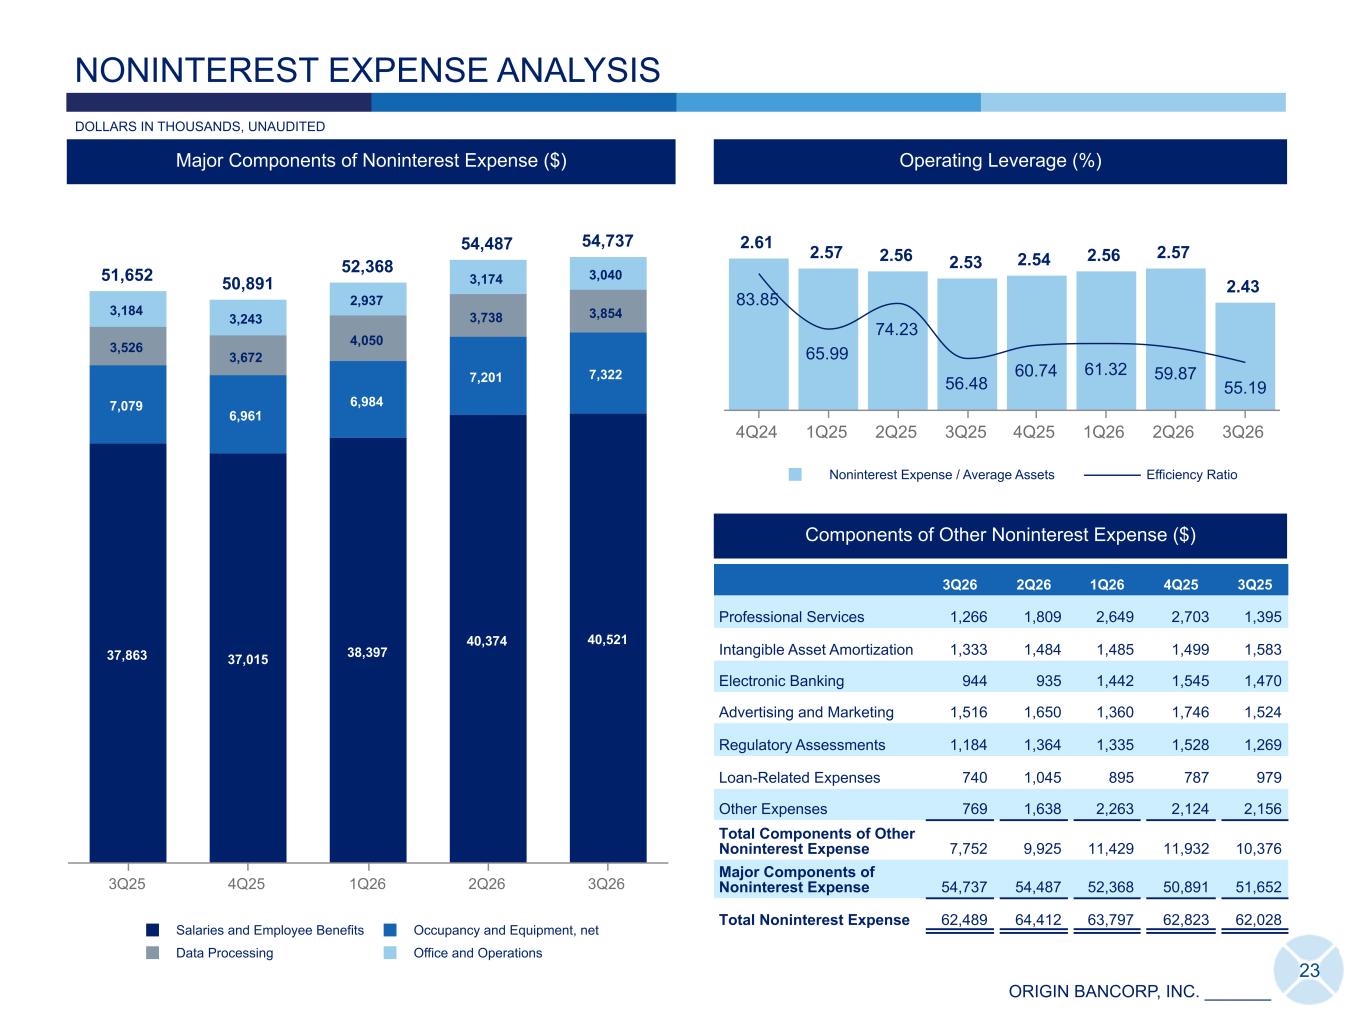
ORIGIN BANCORP, INC. _______ 23 Efficiency Ratio (%) NONINTEREST EXPENSE ANALYSIS Major Components of Noninterest Expense ($) 68.86 83.85 65.99 74.23 56.48 61.32 59.87 59.87 Consolidated Efficiency Ratio 4Q24 1Q25 2Q25 3Q25 4Q25 1Q26 2Q26 3Q26 Operating Leverage (%) 2.61 2.57 2.56 2.53 2.54 2.56 2.57 2.43 83.85 65.99 74.23 56.48 60.74 61.32 59.87 55.19 Noninterest Expense / Average Assets Efficiency Ratio 4Q24 1Q25 2Q25 3Q25 4Q25 1Q26 2Q26 3Q26 51,652 50,891 52,368 54,487 54,737 37,863 37,015 38,397 40,374 40,521 7,079 6,961 6,984 7,201 7,322 3,526 3,672 4,050 3,738 3,8543,184 3,243 2,937 3,174 3,040 Salaries and Employee Benefits Occupancy and Equipment, net Data Processing Office and Operations 3Q25 4Q25 1Q26 2Q26 3Q26 Components of Other Noninterest Expense ($) 3Q26 2Q26 1Q26 4Q25 3Q25 Professional Services 1,266 1,809 2,649 2,703 1,395 Intangible Asset Amortization 1,333 1,484 1,485 1,499 1,583 Electronic Banking 944 935 1,442 1,545 1,470 Advertising and Marketing 1,516 1,650 1,360 1,746 1,524 Regulatory Assessments 1,184 1,364 1,335 1,528 1,269 Loan-Related Expenses 740 1,045 895 787 979 Other Expenses 769 1,638 2,263 2,124 2,156 Total Components of Other Noninterest Expense 7,752 9,925 11,429 11,932 10,376 Major Components of Noninterest Expense 54,737 54,487 52,368 50,891 51,652 Total Noninterest Expense 62,489 64,412 63,797 62,823 62,028 DOLLARS IN THOUSANDS, UNAUDITED
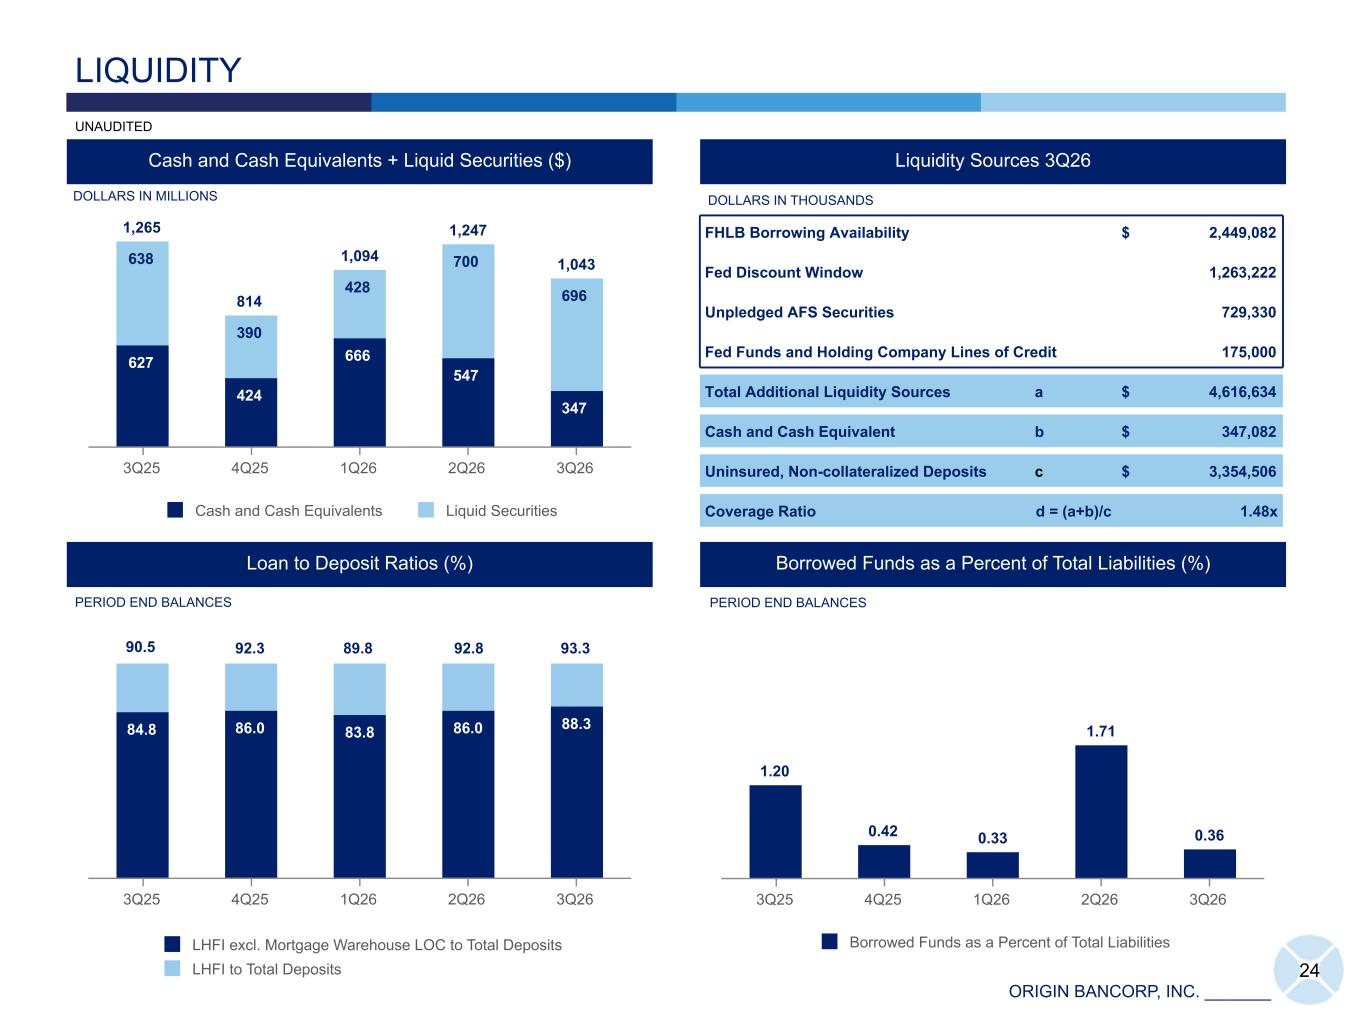
ORIGIN BANCORP, INC. _______ 84.8 86.0 83.8 86.0 88.3 LHFI excl. Mortgage Warehouse LOC to Total Deposits LHFI to Total Deposits 3Q25 4Q25 1Q26 2Q26 3Q26 1,265 814 1,094 1,247 1,043 627 424 666 547 347 638 390 428 700 696 Cash and Cash Equivalents Liquid Securities 3Q25 4Q25 1Q26 2Q26 3Q26 Cash and Cash Equivalents + Liquid Securities ($) 24 LIQUIDITY Loan to Deposit Ratios (%) UNAUDITED Liquidity Sources 3Q26 Borrowed Funds as a Percent of Total Liabilities (%) DOLLARS IN MILLIONS DOLLARS IN THOUSANDS PERIOD END BALANCES PERIOD END BALANCES 1.20 0.42 0.33 1.71 0.36 Borrowed Funds as a Percent of Total Liabilities 3Q25 4Q25 1Q26 2Q26 3Q26 FHLB Borrowing Availability $ 2,449,082 Fed Discount Window 1,263,222 Unpledged AFS Securities 729,330 Fed Funds and Holding Company Lines of Credit 175,000 Total Additional Liquidity Sources a $ 4,616,634 Cash and Cash Equivalent b $ 347,082 Uninsured, Non-collateralized Deposits c $ 3,354,506 Coverage Ratio d = (a+b)/c 1.48x 90.5 92.3 89.8 92.8 93.3
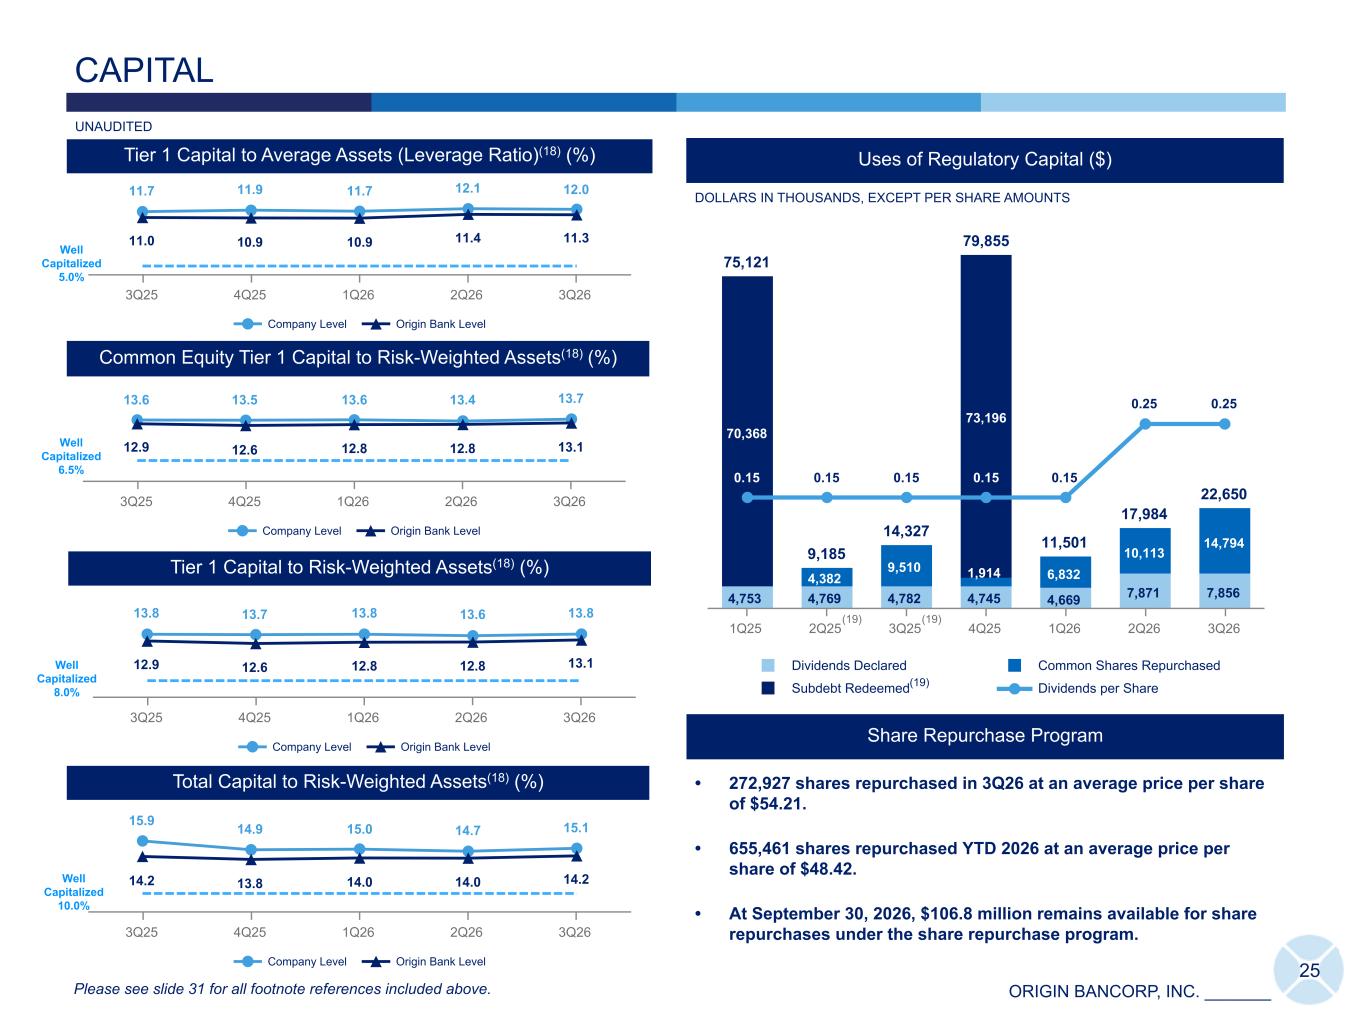
ORIGIN BANCORP, INC. _______ 25 CAPITAL Common Equity Tier 1 Capital to Risk-Weighted Assets(18) (%) ICap ICap Total Capital to Risk-Weighted Assets(18) (%) Tier 1 Capital to Risk-Weighted Assets(18) (%) Tier 1 Capital to Average Assets (Leverage Ratio)(18) (%) Please see slide 31 for all footnote references included above. UNAUDITED Share Repurchase Program • 272,927 shares repurchased in 3Q26 at an average price per share of $54.21. • 655,461 shares repurchased YTD 2026 at an average price per share of $48.42. • At September 30, 2026, $106.8 million remains available for share repurchases under the share repurchase program. 11.7 11.9 11.7 12.1 12.0 11.0 10.9 10.9 11.4 11.3 Company Level Origin Bank Level 3Q25 4Q25 1Q26 2Q26 3Q26 13.8 13.7 13.8 13.6 13.8 12.9 12.6 12.8 12.8 13.1 Company Level Origin Bank Level 3Q25 4Q25 1Q26 2Q26 3Q26 15.9 14.9 15.0 14.7 15.1 14.2 13.8 14.0 14.0 14.2 Company Level Origin Bank Level 3Q25 4Q25 1Q26 2Q26 3Q26 13.6 13.5 13.6 13.4 13.7 12.9 12.6 12.8 12.8 13.1 Company Level Origin Bank Level 3Q25 4Q25 1Q26 2Q26 3Q26 Well Capitalized 5.0% Well Capitalized 6.5% Well Capitalized 10.0% Well Capitalized 8.0% 75,121 9,185 14,327 79,855 11,501 17,984 22,650 4,753 4,769 4,782 4,745 4,669 7,871 7,856 4,382 9,510 1,914 6,832 10,113 14,794 70,368 73,196 0.15 0.15 0.15 0.15 0.15 0.25 0.25 Dividends Declared Common Shares Repurchased Subdebt Redeemed Dividends per Share 1Q25 2Q25 3Q25 4Q25 1Q26 2Q26 3Q26 Uses of Regulatory Capital ($) DOLLARS IN THOUSANDS, EXCEPT PER SHARE AMOUNTS (19) (19) (19)
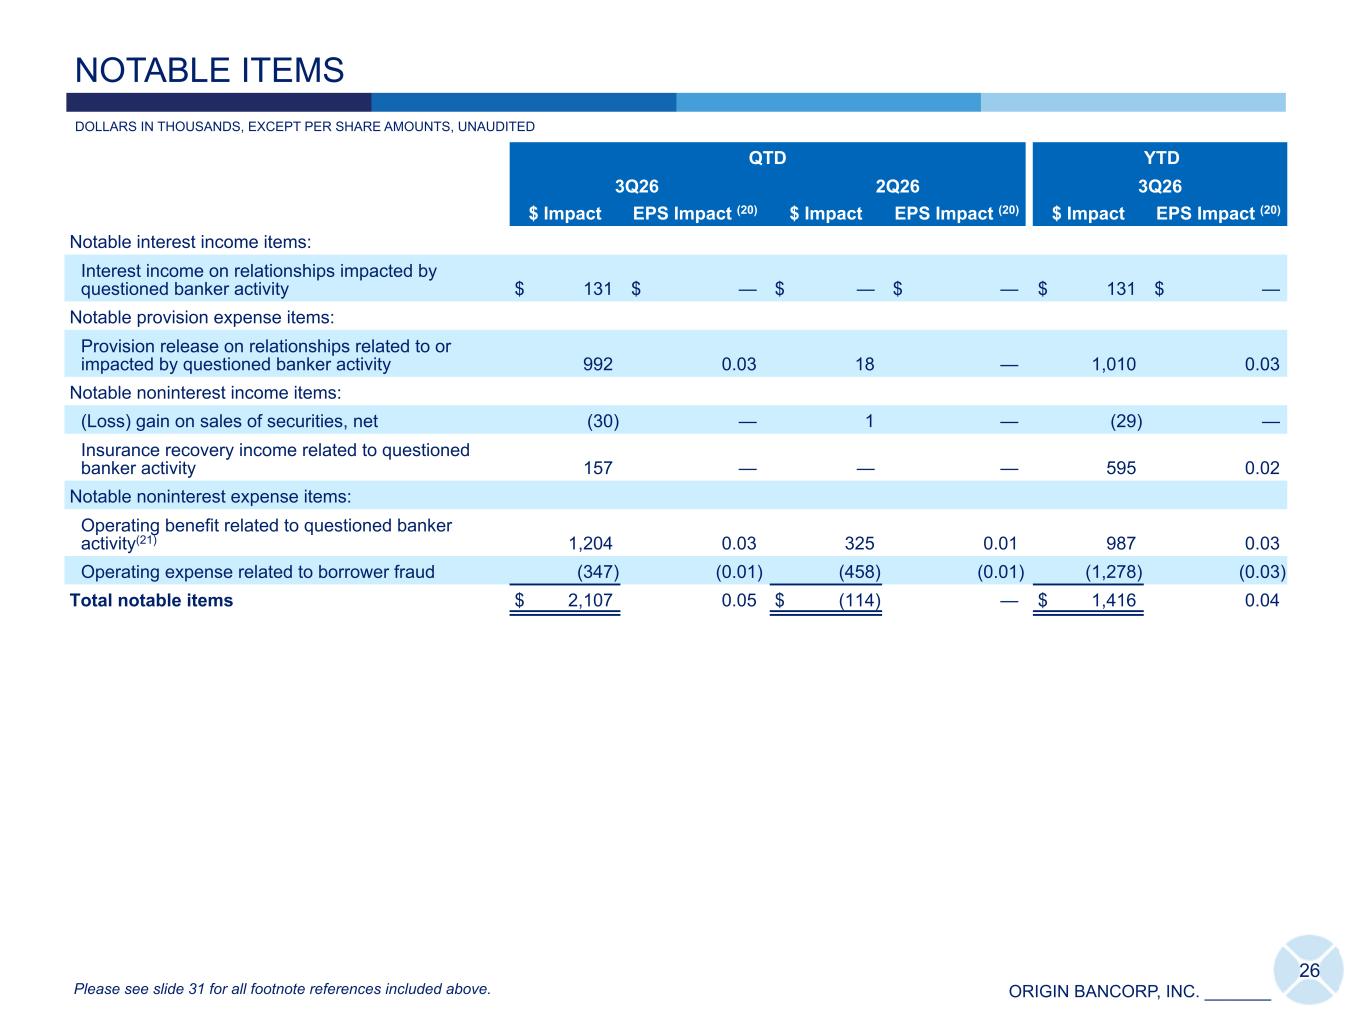
ORIGIN BANCORP, INC. _______ QTD YTD 3Q26 2Q26 3Q26 $ Impact EPS Impact (20) $ Impact EPS Impact (20) $ Impact EPS Impact (20) Notable interest income items: Interest income on relationships impacted by questioned banker activity $ 131 $ — $ — $ — $ 131 $ — Notable provision expense items: Provision release on relationships related to or impacted by questioned banker activity 992 0.03 18 — 1,010 0.03 Notable noninterest income items: (Loss) gain on sales of securities, net (30) — 1 — (29) — Insurance recovery income related to questioned banker activity 157 — — — 595 0.02 Notable noninterest expense items: Operating benefit related to questioned banker activity(21) 1,204 0.03 325 0.01 987 0.03 Operating expense related to borrower fraud (347) (0.01) (458) (0.01) (1,278) (0.03) Total notable items $ 2,107 0.05 $ (114) — $ 1,416 0.04 26 DOLLARS IN THOUSANDS, EXCEPT PER SHARE AMOUNTS, UNAUDITED NOTABLE ITEMS Please see slide 31 for all footnote references included above.
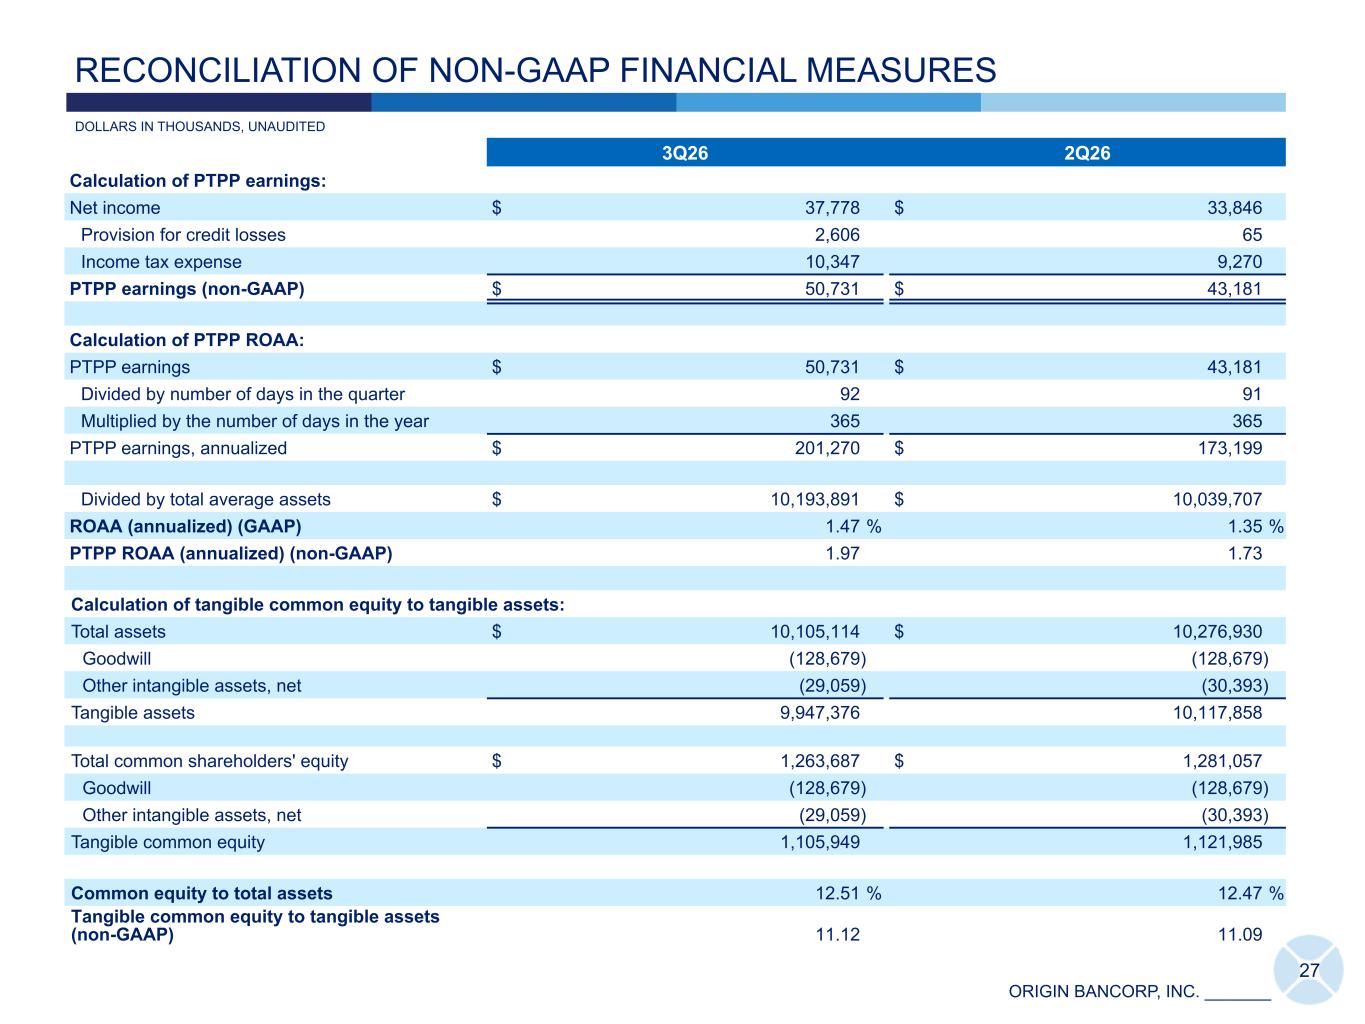
ORIGIN BANCORP, INC. _______ 3Q26 2Q26 Calculation of PTPP earnings: Net income $ 37,778 $ 33,846 Provision for credit losses 2,606 65 Income tax expense 10,347 9,270 PTPP earnings (non-GAAP) $ 50,731 $ 43,181 Calculation of PTPP ROAA: PTPP earnings $ 50,731 $ 43,181 Divided by number of days in the quarter 92 91 Multiplied by the number of days in the year 365 365 PTPP earnings, annualized $ 201,270 $ 173,199 Divided by total average assets $ 10,193,891 $ 10,039,707 ROAA (annualized) (GAAP) 1.47 % 1.35 % PTPP ROAA (annualized) (non-GAAP) 1.97 1.73 Calculation of tangible common equity to tangible assets: Total assets $ 10,105,114 $ 10,276,930 Goodwill (128,679) (128,679) Other intangible assets, net (29,059) (30,393) Tangible assets 9,947,376 10,117,858 Total common shareholders' equity $ 1,263,687 $ 1,281,057 Goodwill (128,679) (128,679) Other intangible assets, net (29,059) (30,393) Tangible common equity 1,105,949 1,121,985 Common equity to total assets 12.51 % 12.47 % Tangible common equity to tangible assets (non-GAAP) 11.12 11.09 27 DOLLARS IN THOUSANDS, UNAUDITED RECONCILIATION OF NON-GAAP FINANCIAL MEASURES
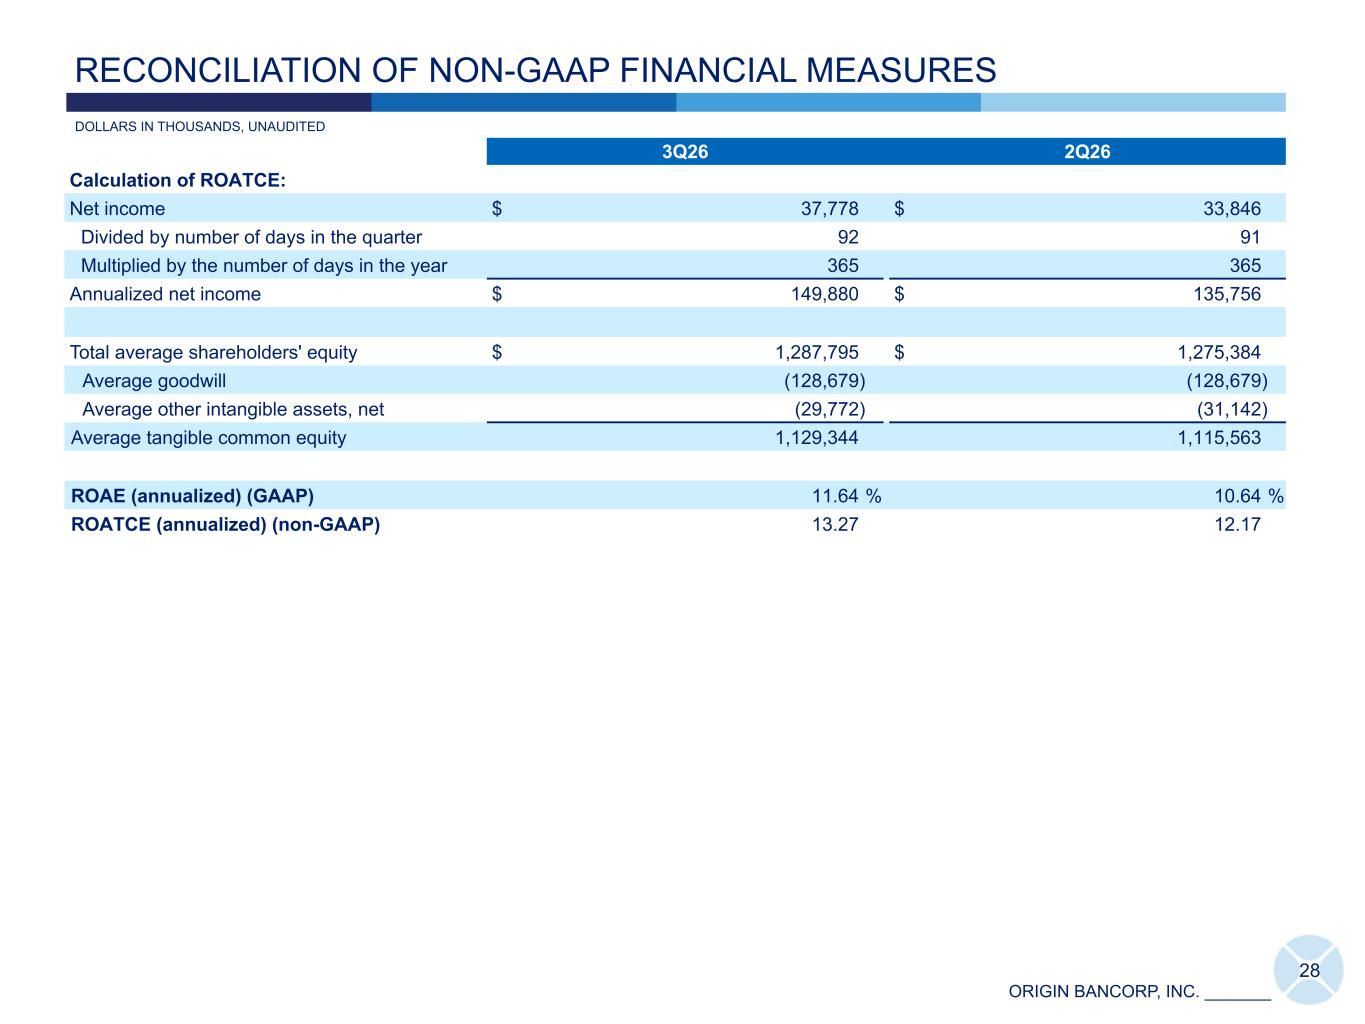
ORIGIN BANCORP, INC. _______ 3Q26 2Q26 Calculation of ROATCE: Net income $ 37,778 $ 33,846 Divided by number of days in the quarter 92 91 Multiplied by the number of days in the year 365 365 Annualized net income $ 149,880 $ 135,756 Total average shareholders' equity $ 1,287,795 $ 1,275,384 Average goodwill (128,679) (128,679) Average other intangible assets, net (29,772) (31,142) Average tangible common equity 1,129,344 1,115,563 ROAE (annualized) (GAAP) 11.64 % 10.64 % ROATCE (annualized) (non-GAAP) 13.27 12.17 28 DOLLARS IN THOUSANDS, UNAUDITED RECONCILIATION OF NON-GAAP FINANCIAL MEASURES
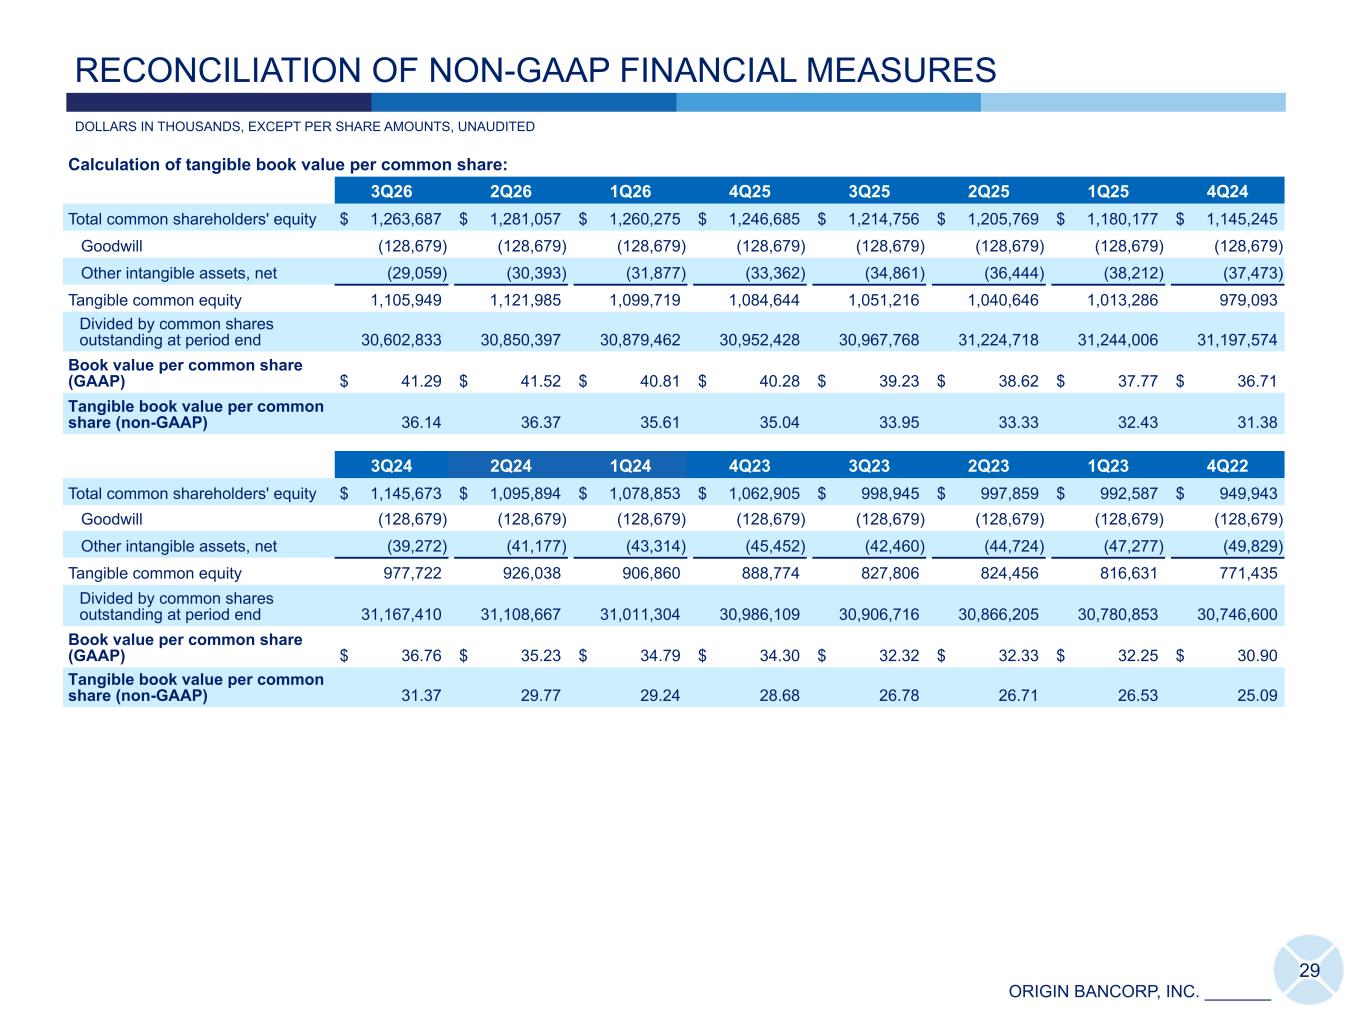
ORIGIN BANCORP, INC. _______ Calculation of tangible book value per common share: 3Q26 2Q26 1Q26 4Q25 3Q25 2Q25 1Q25 4Q24 Total common shareholders' equity $ 1,263,687 $ 1,281,057 $ 1,260,275 $ 1,246,685 $ 1,214,756 $ 1,205,769 $ 1,180,177 $ 1,145,245 Goodwill (128,679) (128,679) (128,679) (128,679) (128,679) (128,679) (128,679) (128,679) Other intangible assets, net (29,059) (30,393) (31,877) (33,362) (34,861) (36,444) (38,212) (37,473) Tangible common equity 1,105,949 1,121,985 1,099,719 1,084,644 1,051,216 1,040,646 1,013,286 979,093 Divided by common shares outstanding at period end 30,602,833 30,850,397 30,879,462 30,952,428 30,967,768 31,224,718 31,244,006 31,197,574 Book value per common share (GAAP) $ 41.29 $ 41.52 $ 40.81 $ 40.28 $ 39.23 $ 38.62 $ 37.77 $ 36.71 Tangible book value per common share (non-GAAP) 36.14 36.37 35.61 35.04 33.95 33.33 32.43 31.38 3Q24 2Q24 1Q24 4Q23 3Q23 2Q23 1Q23 4Q22 Total common shareholders' equity $ 1,145,673 $ 1,095,894 $ 1,078,853 $ 1,062,905 $ 998,945 $ 997,859 $ 992,587 $ 949,943 Goodwill (128,679) (128,679) (128,679) (128,679) (128,679) (128,679) (128,679) (128,679) Other intangible assets, net (39,272) (41,177) (43,314) (45,452) (42,460) (44,724) (47,277) (49,829) Tangible common equity 977,722 926,038 906,860 888,774 827,806 824,456 816,631 771,435 Divided by common shares outstanding at period end 31,167,410 31,108,667 31,011,304 30,986,109 30,906,716 30,866,205 30,780,853 30,746,600 Book value per common share (GAAP) $ 36.76 $ 35.23 $ 34.79 $ 34.30 $ 32.32 $ 32.33 $ 32.25 $ 30.90 Tangible book value per common share (non-GAAP) 31.37 29.77 29.24 28.68 26.78 26.71 26.53 25.09 29 RECONCILIATION OF NON-GAAP FINANCIAL MEASURES DOLLARS IN THOUSANDS, EXCEPT PER SHARE AMOUNTS, UNAUDITED
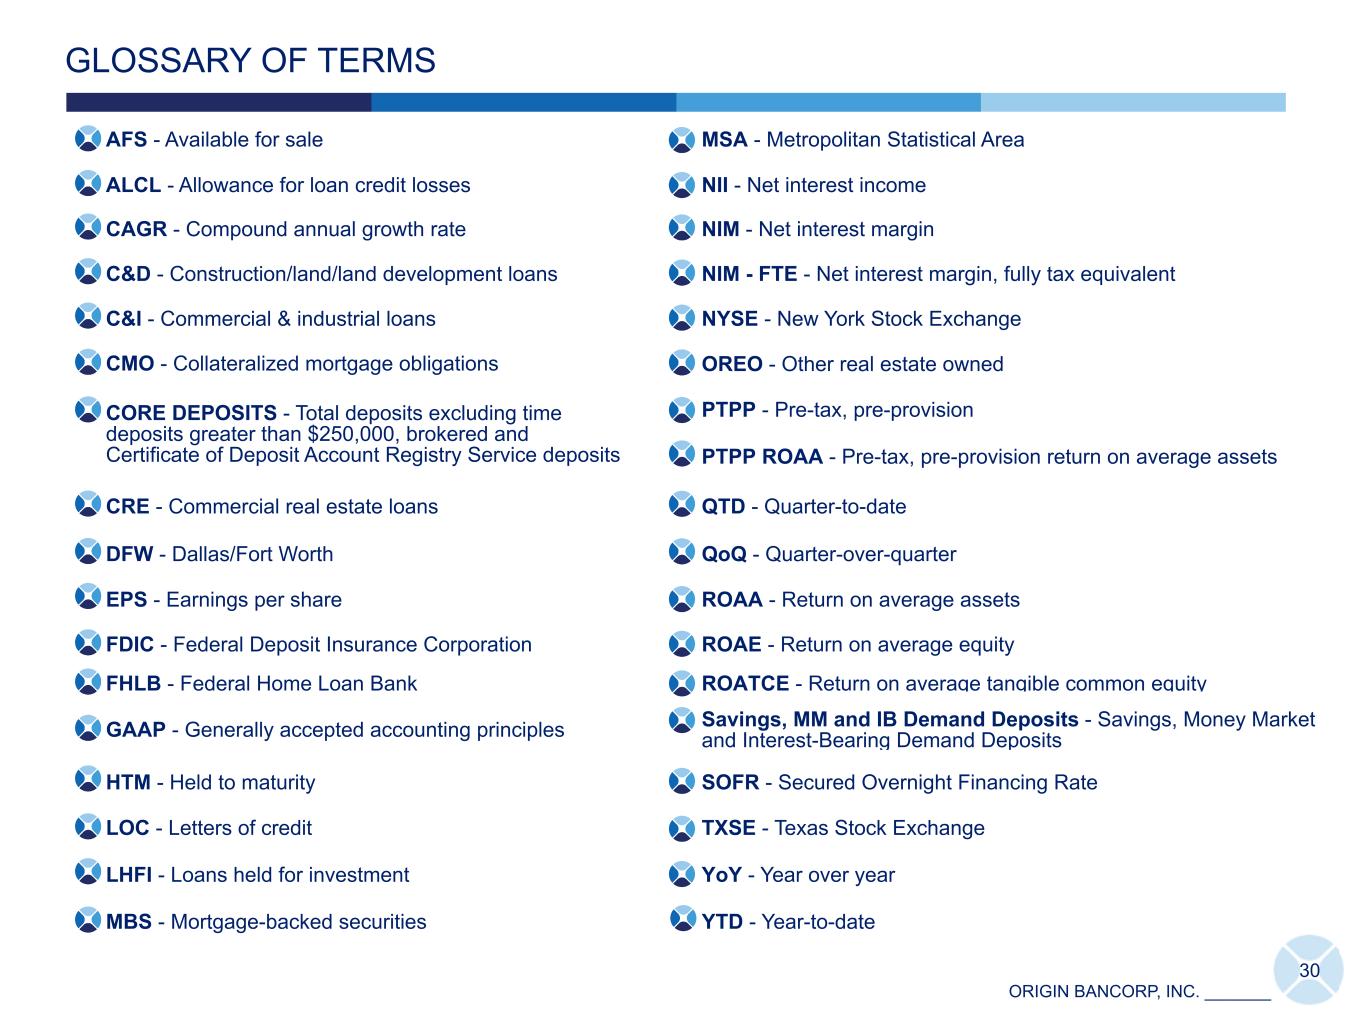
ORIGIN BANCORP, INC. _______ AFS - Available for sale MSA - Metropolitan Statistical Area ALCL - Allowance for loan credit losses NII - Net interest income CAGR - Compound annual growth rate NIM - Net interest margin C&D - Construction/land/land development loans NIM - FTE - Net interest margin, fully tax equivalent C&I - Commercial & industrial loans NYSE - New York Stock Exchange CMO - Collateralized mortgage obligations OREO - Other real estate owned CORE DEPOSITS - Total deposits excluding time deposits greater than $250,000, brokered and Certificate of Deposit Account Registry Service deposits PTPP - Pre-tax, pre-provision PTPP ROAA - Pre-tax, pre-provision return on average assets CRE - Commercial real estate loans QTD - Quarter-to-date DFW - Dallas/Fort Worth QoQ - Quarter-over-quarter EPS - Earnings per share ROAA - Return on average assets FDIC - Federal Deposit Insurance Corporation ROAE - Return on average equity FHLB - Federal Home Loan Bank ROATCE - Return on average tangible common equity GAAP - Generally accepted accounting principles Savings, MM and IB Demand Deposits - Savings, Money Market and Interest-Bearing Demand Deposits HTM - Held to maturity SOFR - Secured Overnight Financing Rate LOC - Letters of credit TXSE - Texas Stock Exchange LHFI - Loans held for investment YoY - Year over year MBS - Mortgage-backed securities YTD - Year-to-date GLOSSARY OF TERMS 30
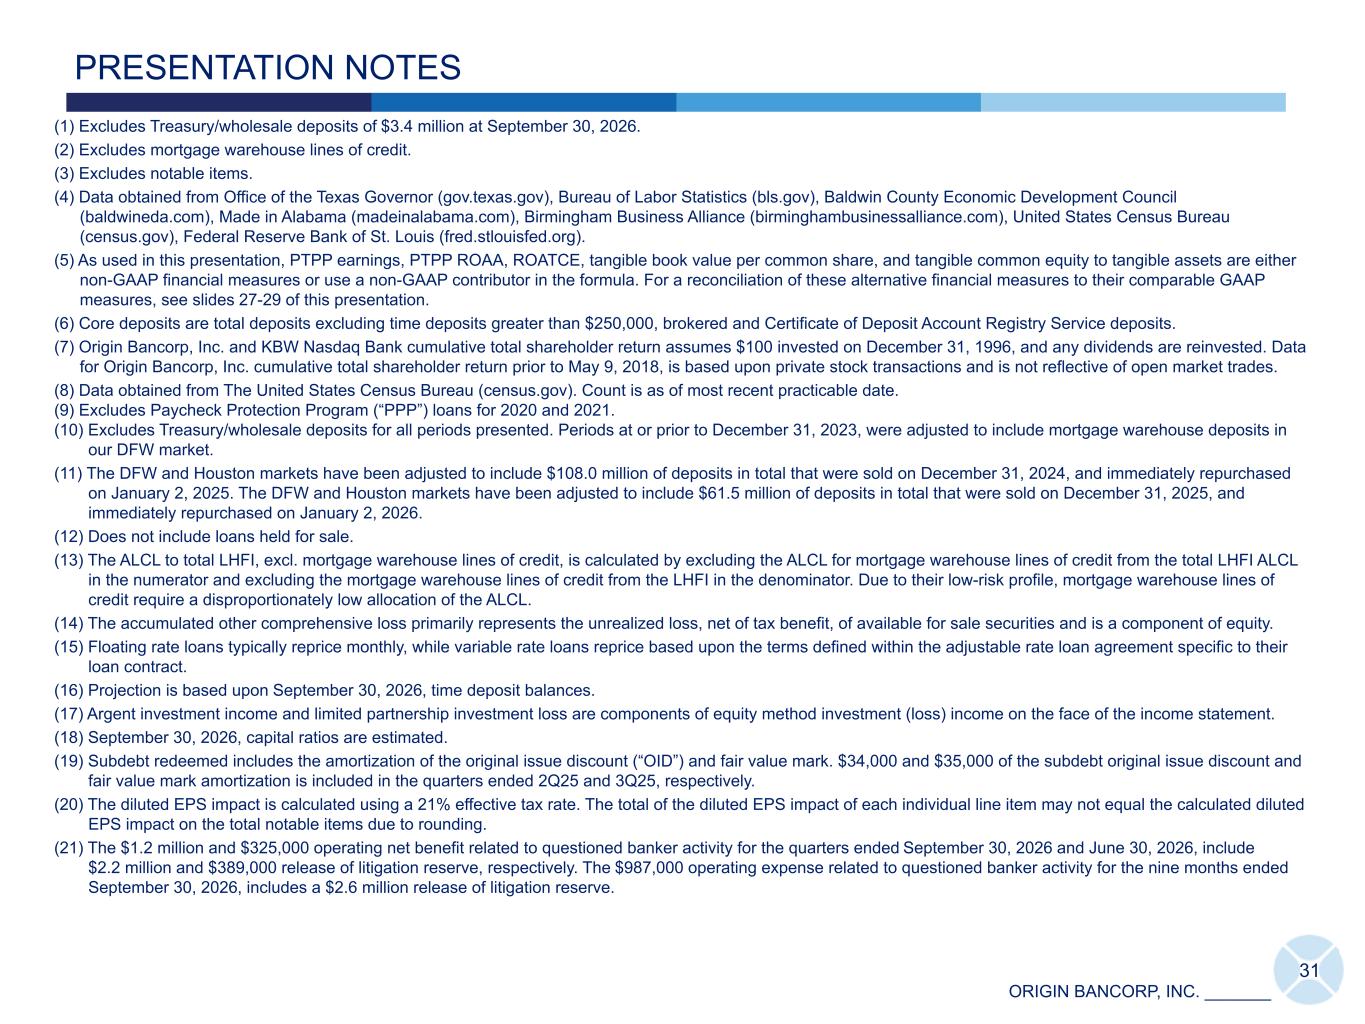
ORIGIN BANCORP, INC. _______ 31 PRESENTATION NOTES (1) Excludes Treasury/wholesale deposits of $3.4 million at September 30, 2026. (2) Excludes mortgage warehouse lines of credit. (3) Excludes notable items. (4) Data obtained from Office of the Texas Governor (gov.texas.gov), Bureau of Labor Statistics (bls.gov), Baldwin County Economic Development Council (baldwineda.com), Made in Alabama (madeinalabama.com), Birmingham Business Alliance (birminghambusinessalliance.com), United States Census Bureau (census.gov), Federal Reserve Bank of St. Louis (fred.stlouisfed.org). (5) As used in this presentation, PTPP earnings, PTPP ROAA, ROATCE, tangible book value per common share, and tangible common equity to tangible assets are either non-GAAP financial measures or use a non-GAAP contributor in the formula. For a reconciliation of these alternative financial measures to their comparable GAAP measures, see slides 27-29 of this presentation. (6) Core deposits are total deposits excluding time deposits greater than $250,000, brokered and Certificate of Deposit Account Registry Service deposits. (7) Origin Bancorp, Inc. and KBW Nasdaq Bank cumulative total shareholder return assumes $100 invested on December 31, 1996, and any dividends are reinvested. Data for Origin Bancorp, Inc. cumulative total shareholder return prior to May 9, 2018, is based upon private stock transactions and is not reflective of open market trades. (8) Data obtained from The United States Census Bureau (census.gov). Count is as of most recent practicable date. (9) Excludes Paycheck Protection Program (“PPP”) loans for 2020 and 2021. (10) Excludes Treasury/wholesale deposits for all periods presented. Periods at or prior to December 31, 2023, were adjusted to include mortgage warehouse deposits in our DFW market. (11) The DFW and Houston markets have been adjusted to include $108.0 million of deposits in total that were sold on December 31, 2024, and immediately repurchased on January 2, 2025. The DFW and Houston markets have been adjusted to include $61.5 million of deposits in total that were sold on December 31, 2025, and immediately repurchased on January 2, 2026. (12) Does not include loans held for sale. (13) The ALCL to total LHFI, excl. mortgage warehouse lines of credit, is calculated by excluding the ALCL for mortgage warehouse lines of credit from the total LHFI ALCL in the numerator and excluding the mortgage warehouse lines of credit from the LHFI in the denominator. Due to their low-risk profile, mortgage warehouse lines of credit require a disproportionately low allocation of the ALCL. (14) The accumulated other comprehensive loss primarily represents the unrealized loss, net of tax benefit, of available for sale securities and is a component of equity. (15) Floating rate loans typically reprice monthly, while variable rate loans reprice based upon the terms defined within the adjustable rate loan agreement specific to their loan contract. (16) Projection is based upon September 30, 2026, time deposit balances. (17) Argent investment income and limited partnership investment loss are components of equity method investment (loss) income on the face of the income statement. (18) September 30, 2026, capital ratios are estimated. (19) Subdebt redeemed includes the amortization of the original issue discount (“OID”) and fair value mark. $34,000 and $35,000 of the subdebt original issue discount and fair value mark amortization is included in the quarters ended 2Q25 and 3Q25, respectively. (20) The diluted EPS impact is calculated using a 21% effective tax rate. The total of the diluted EPS impact of each individual line item may not equal the calculated diluted EPS impact on the total notable items due to rounding. (21) The $1.2 million and $325,000 operating net benefit related to questioned banker activity for the quarters ended September 30, 2026 and June 30, 2026, include $2.2 million and $389,000 release of litigation reserve, respectively. The $987,000 operating expense related to questioned banker activity for the nine months ended September 30, 2026, includes a $2.6 million release of litigation reserve.
Exhibit 99.3

FOR IMMEDIATE RELEASE
October 28, 2026
Origin Bancorp, Inc. Announces Declaration of Quarterly Cash Dividend
RUSTON, LOUISIANA (October 28, 2026) - Origin Bancorp, Inc. (NYSE: OBK) ("Origin"), the holding company for Origin Bank, today announced that on October 28, 2026, its board of directors declared a quarterly cash dividend of $0.28 per share of its common stock. The cash dividend will be paid on November 30, 2026, to stockholders of record as of the close of business on November 13, 2026.
About Origin Bancorp, Inc.
Origin Bancorp, Inc. is a financial holding company headquartered in Ruston, Louisiana. Origin’s wholly owned bank subsidiary, Origin Bank, was founded in 1912 in Choudrant, Louisiana. Deeply rooted in Origin’s history is a culture committed to providing personalized relationship banking to businesses, municipalities, and personal clients to enrich the lives of the people in the communities it serves. Origin provides a broad range of financial services and currently operates more than 57 locations in Dallas/Fort Worth, East Texas, Houston, North Louisiana, Mississippi, Alabama and the Florida Panhandle. In addition, Origin provides a broad range of insurance agency products and services through its wholly owned insurance agency subsidiary, Forth Insurance, LLC. For more information, visit www.origin.bank and www.forthinsurance.com.
Forward-Looking Statements
When used in filings by Origin Bancorp, Inc. (the "Company") with the Securities and Exchange Commission (the "SEC"), in the Company's press releases or other public or stockholder communications, and in oral statements made with the approval of an authorized executive officer, the words or phrases "anticipates," "believes," "estimates," "expects," “foresees,” "intends," "plans," "projects," and similar expressions or future or conditional verbs such as "could," "may," “might,” "should," "will," and "would" or variations of such terms" are intended to identify "forward-looking statements" within the meaning of the Private Securities Litigation Reform Act of 1995. Such statements are subject to certain risks and uncertainties that could cause actual results to differ materially from historical earnings and those presently anticipated or projected. Factors that might cause such a difference include among other things: the expected payment date of its quarterly cash dividend; changes in economic conditions; other legislative changes generally; changes in policies by regulatory agencies; fluctuations in interest rates; the risks of lending and investing activities, including changes in the level and direction of loan delinquencies and write-offs and changes in estimates of the adequacy of the allowance for loan losses; the Company's ability to access cost-effective funding; fluctuations in real estate values and both residential and commercial real estate market conditions; demand for loans and deposits in the Company's market area; competition; and changes in management’s business strategies and other factors set forth in the Company's filings with the SEC.
The Company does not undertake and specifically declines any obligation - to update or revise any forward-looking statements to reflect events or circumstances that occur after the date of such statements or to reflect the occurrence of anticipated or unanticipated events.
Contact Information
Investor Relations
Chris Reigelman
318-497-3177
chris@origin.bank
Media Contact
Ryan Kilpatrick
318-232-7472
rkilpatrick@origin.bank